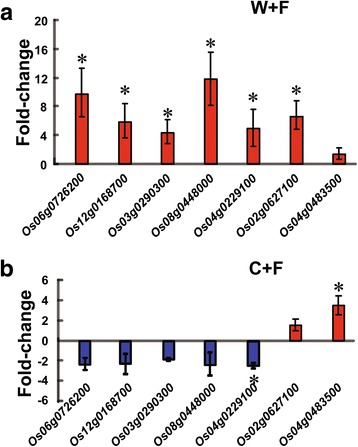
Fig. 4.

Validation of the RNA-sequencing data by quantitative reverse transcription PCR (qRT-PCR). Seven genes were selected from the RNA-sequencing data for qRT-PCR. a Expression patterns in C and C + F groups. b Expression patterns in W and W + F groups. The four treatments were non-inoculated cultivated rice (C), cultivated rice inoculated with Magnaporthe oryzae (C + F), non-inoculated wild rice (W), and wild rice inoculated with M. oryzae (W + F). The error bars represent standard deviations of the means. The asterisks above the bars indicate significant differences among the samples at P < 0.05
