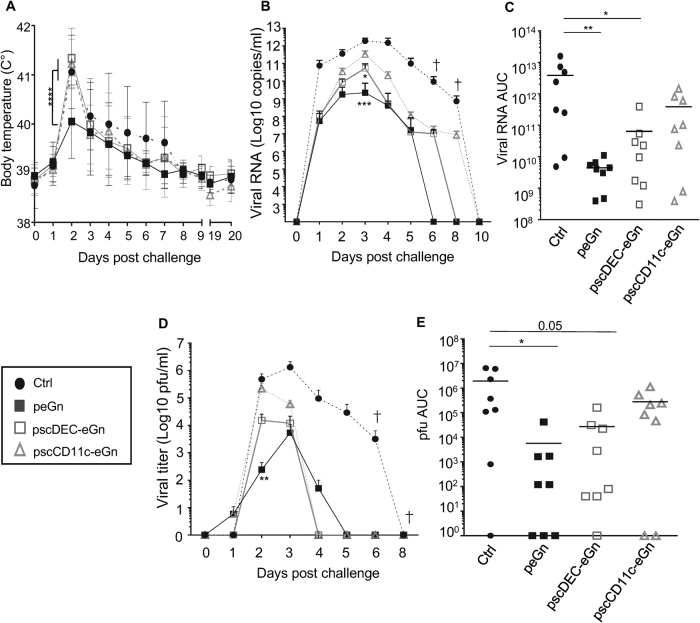
Fig. 4.
Body temperature and viremia upon RVFV challenge in lambs vaccinated with peGn, pscDEC-eGn and pscCD11c-eGn. The vaccinated and control sheep were challenged with the RVFV 56/74 strain (106 TCID50) 3 weeks after the last immunization. a The rectal temperature was measured daily. Data are mean ± SD of individual values (n = 8 sheep per experimental group). The p values were determined according to a two-way ANOVA test with Bonferroni’s correction (****p < 0.0001). b The viral RNA copy numbers/ml in serum were quantified by qRT-PCR and the mean values for each group with the top standard error of mean are shown over times. c The viral RNA area under the curve (viral RNA AUC) was calculated over 10 days for each animal. d The plaque-forming unit load (pfu/ml) were quantified in viral RNA-positive sera and the mean values for each group with the top standard error of mean are shown over times. e The pfu area under the curve (pfu AUC) was calculated over 8 days. Each symbol represents an individual animal and the mean is indicated by a horizontal line (n = 8 per experimental group). In (b–d), the p values between the vaccinated and control groups were determined with the Mann–Whitney test (*p < 0.05; **p < 0.01; ***p < 0.001). A cross symbol indicates death

