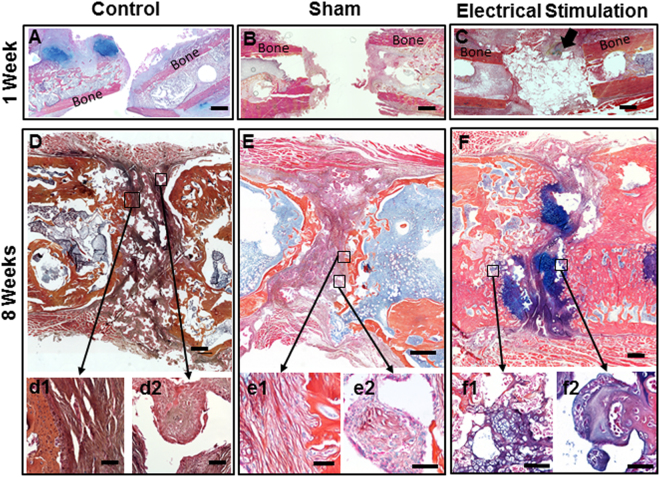
Figure 3.
Histological sections of femur defect. After one week post-surgery (A) Control, (B) Sham, and (C) Electrically stimulated groups were stained with Alcian Blue, Orange-G and Hematoxylin. Histological assessment at this time point showed no regeneration in control and sham groups. Arrow shows endochondral ossification center in electrically stimulated group, (scale bar = 1 mm). At eight weeks post-surgery (D) Control, (E) Sham, and (F) Electrically stimulated groups, were assessed with the same histological staining, (Scale bar = 500 μm). Bottom rows are higher magnification images from the location of interest; (d1) fibrous connective tissue within the defect in the control group, (d2) scaffold material covered with fibrous tissue, (e1) fibrous connective tissue within the defect in the sham group, (e2) scaffold material covered with mixed tissues, (f1) cartilaginous and bony tissues within the defect in the experimental group, and (f2) scaffold material covered with cartilaginous and bony tissues, (20×) (scale bar = 50 μm).

