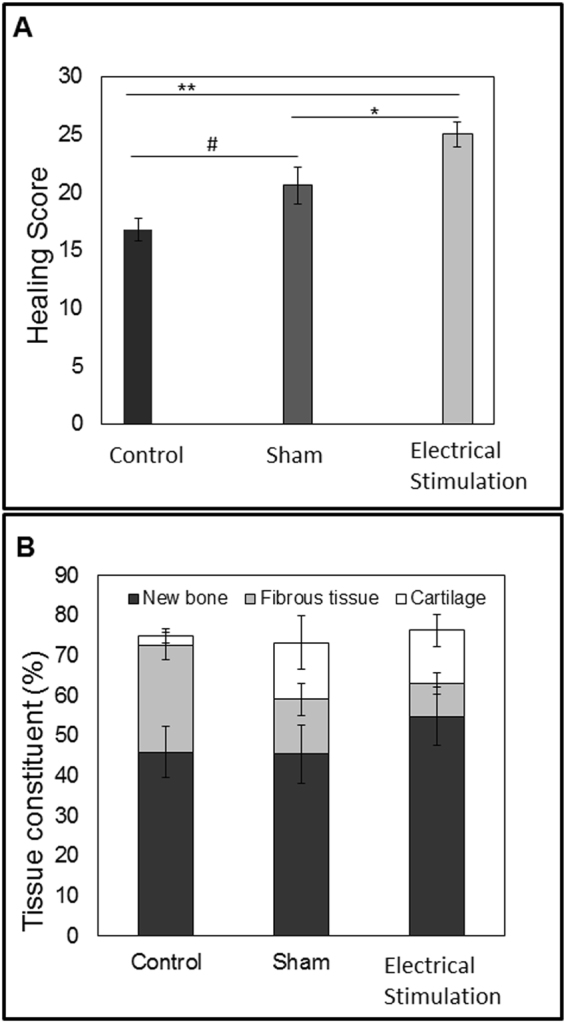
Figure 4.

Bone healing score and tissue constituent percentage of the defect. At eight weeks post-surgery, (A) Healing scores were calculated using histological image analysis. Data are shown as mean ± SD (n = 5). Experimental group scored significantly higher than control and sham groups, (#p < 0.1; *p < 0.05; **p < 0.01) (B) Histomorphometric distribution of newly formed bone, fibrous, and cartilage tissues within the defect, at eight weeks post-surgery. Percentage measured from the whole defect area using ImageJ. Data are shown as mean ± SD (n = 5).
