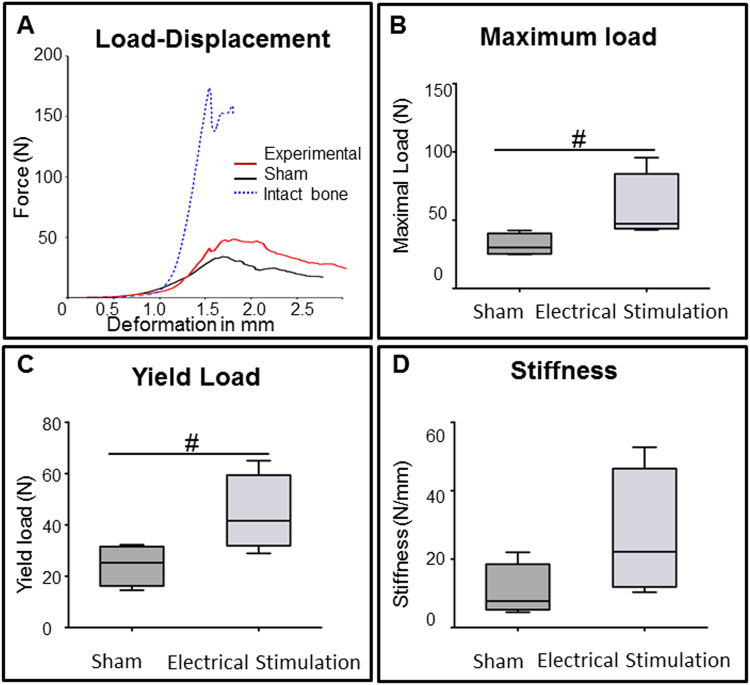
Figure 6.
Mechanical properties of newly formed bone in the defect. (A) Load displacement diagram of representative femur samples from sham (black), experimental (red) group and intact bone (blue). (B) Maximum load before fracture was measured at eight weeks after surgery. Maximum load was higher in experimental compared to sham group (p < 0.1). (C) Yield load, in the experimental group was higher than in the sham group (p = 0.058). (D) Stiffness was not different between sham and experimental groups (#p < 0.1).

