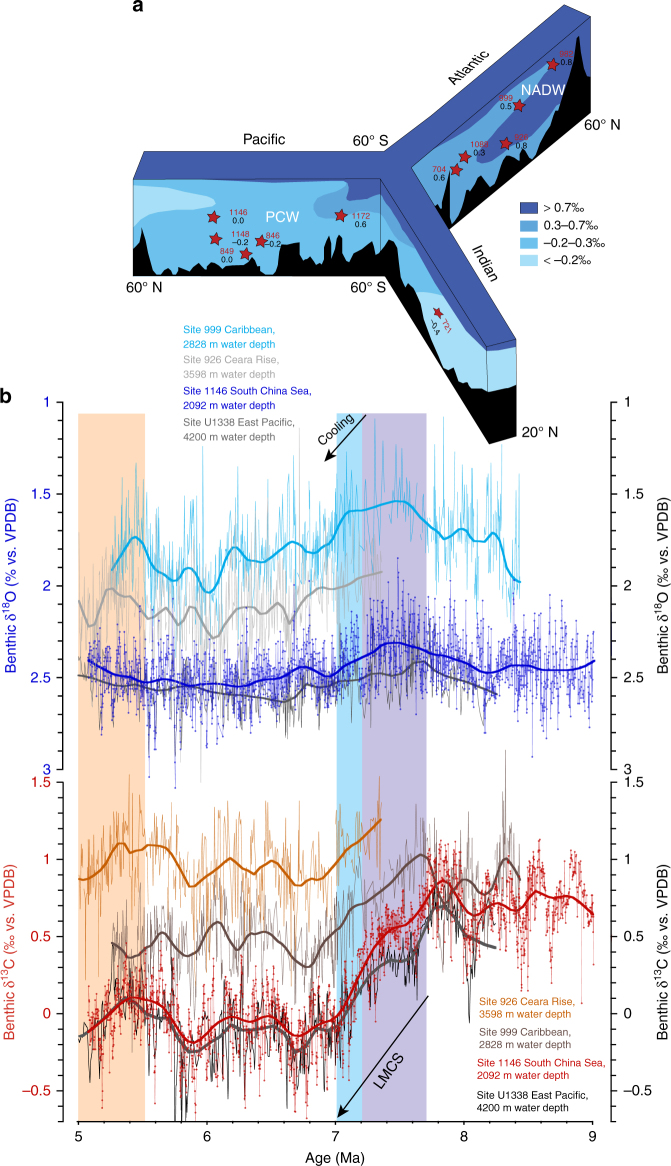
Fig. 6.
Comparison of late Miocene inter-basinal benthic δ18O and δ13C gradients. a Vertical distribution of δ13C in world’s oceans following late Miocene δ13C shift. Averaged values over interval 7–5 Ma for key sites in the Pacific, Atlantic, Indian, and Southern Oceans compiled from refs. 22,54,55,76, NADW: North Atlantic Deep Water, PCW: Pacific Central Water. b Late Miocene evolution of inter-basinal benthic δ18O and δ13C gradients: comparison of Pacific ODP Site 1146 and Atlantic ODP Sites 926 and 99922,23 and equatorial Pacific IODP Site U133855 over interval 9–5 Ma. Stable isotope data from Sites 926 and 999 are plotted on originally published age models. Over the interval 8.2–7.5 Ma, the Site U1338 age model was adjusted to that of Site 1146 by tuning the δ13C records. Lilac shading marks global δ13C decline coincident with planktic δ18O increase and high-amplitude obliquity modulation of benthic δ18O. Blue shading marks final stage of global δ13C decline. Light orange shading marks climate warming after 5.5 Ma. Smooth curve in b fitted using locally weighted least squared error (Lowess) method

