Fig. 1.
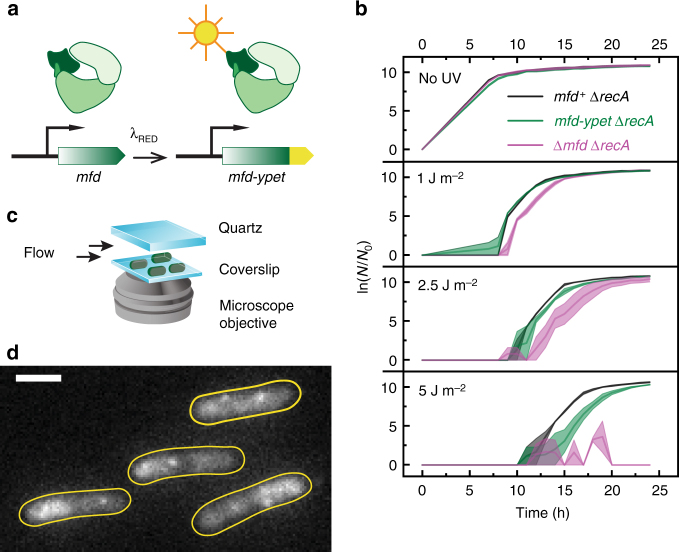
Visualization of Mfd in live Escherichia coli. a Schematic of construction of mfd-ypet strain using λ Red recombination. The native gene is replaced by a chromosomal mfd-ypet fusion under its native promoter. b The chromosomal mfd-ypet fusion allele retains function when assayed for UV-survival. Growth curves of mfd+ ΔrecA (black), mfd-ypet ΔrecA (green) and Δmfd ΔrecA (magenta) following exposure to various doses of 254-nm light. N0 and N are the numbers of cells at the beginning of the experiment and at the time of measurement respectively. Shaded error bars represent standard error of the mean of two measurements, with each measurement being an average of two technical replicates. c Schematic of experimental setup for visualizing Mfd-YPet in live cells. d Representative fluorescence image of mfd-ypet cells upon illumination with 514-nm light. Image is an average projection of ten continuous 100-ms frames. Cell outlines (yellow) were drawn based on the bright-field image. Scale bar, 2 µm

