Fig. 4.
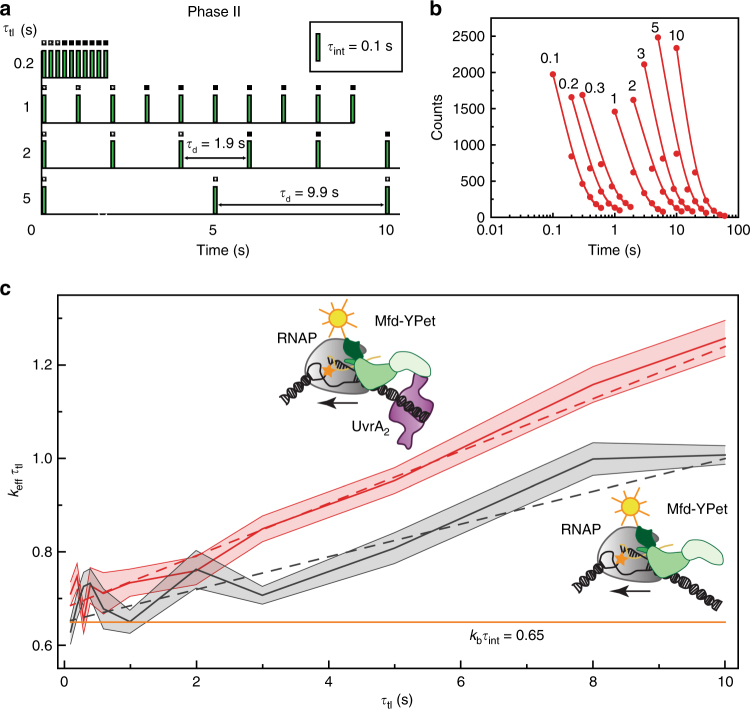
Kinetics of association of Mfd-YPet with RNA polymerase in live cells. a Intracellular off-rate constants of Mfd-YPet were measured using an interval imaging scheme. Imaging was performed in two phases: in the first phase, continuous illumination was applied to bleach the signal followed by a reactivation phase (shown here) where photo-reactivated molecules were visualized. In this imaging scheme, a dark frame with a varying duration (τd) was inserted between consecutive acquisition frames (green bars, τint = 0.1 s) in phase II (reactivation phase). Time-lapse time (τtl) is the sum of τint and τd. b Cumulative residence time distributions of Mfd-YPet foci in mfd-ypet uvrA+ for various time-lapse times (τtl; values are indicated above each trace). Red circles represent combined observations from nine independent experiments. Effective off-rate constant (keff) is obtained from the exponential fit (line) to the experimental data at each time-lapse time. c keffτtl vs. τtl plot for the determination of the off-rate constants (koff) of Mfd-YPet in mfd-ypet uvrA+ (red curve) and mfd-ypet ΔuvrA (grey curve) cells. Shaded error bars represent standard deviations of the bootstrap distribution of keff τtl for the corresponding τtl. Dash lines represent linear least squares fits to the corresponding data. The orange line (continuous) represents a hypothetical static binding with koff equal to zero and kbτint equal to 0.65. Cartoons (insets) represent possible Mfd-RNAP complexes forming in mfd-ypet uvrA+ (top) and mfd-ypet ΔuvrA (bottom) cells

