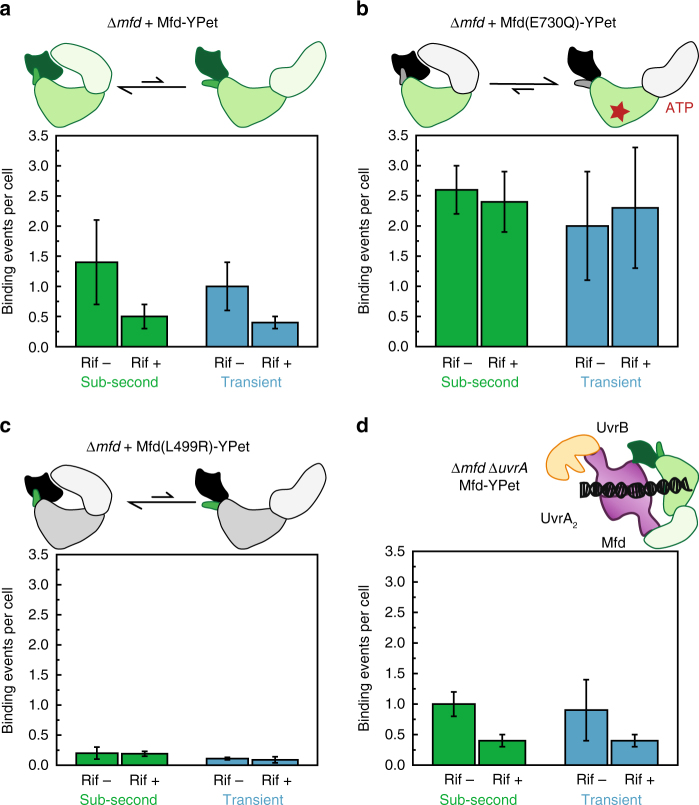
Fig. 5.
Influence of rifampicin on binding of plasmid-based Mfd-YPet and mutants. Bar plots represent sub-second (green) and transient (blue) binding events detected in a−c Δmfd cells expressing a Mfd-YPet, b Mfd(E730Q)-YPet and c Mfd(L499R)-YPet, and in d Δmfd ΔuvrA cells expressing Mfd-YPet. Cells grew in the absence (Rif–) or presence of Rif (Rif+, 50 µL per mL) for 1 h in the flow cell prior to imaging. Error bars are standard deviations from three experiments. a−c Cartoons illustrate the dynamic equilibrium of conformational states of Mfd and mutants. d The cartoon illustrates the hypothetical complex UvrB-UvrA2-Mfd

