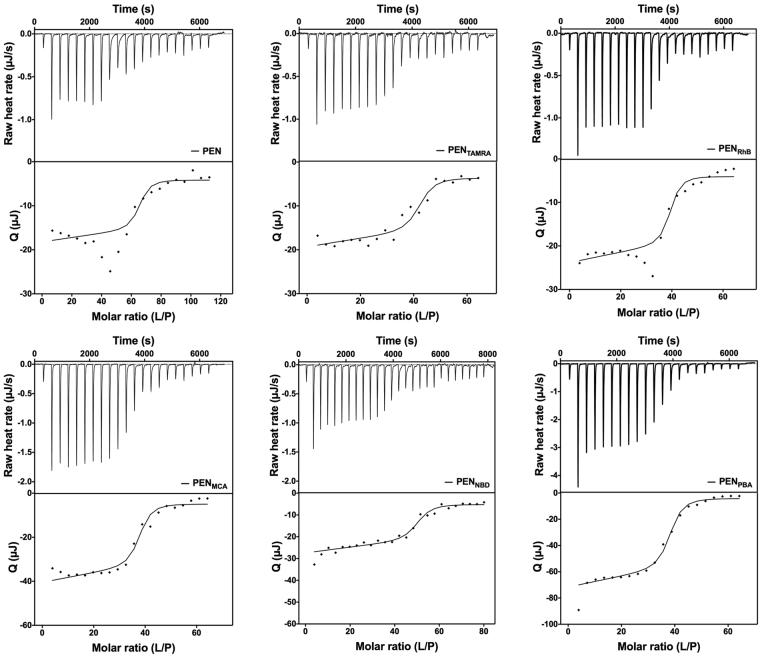
Figure 4.
Representative titration calorimetric curves from ITC experiments conducted at 37 °C. Top graphs show the injection peaks, with each peak corresponding to the injection of 1.96 µL (except that 0.48 µL was used for the first peak) of 20 mM POPC:POPG (80:20 % (mol/mol)) lipid vesicles into 177 µL peptide in aqueous medium, pH 7.4 (70 µM for fluorophore-labeled PEN and 40 µM for PEN). Bottom graphs show the corresponding integrated injection heats as a function of lipid-to-peptide (L/P) molar ratio. The solid lines are the best fits to the data.

