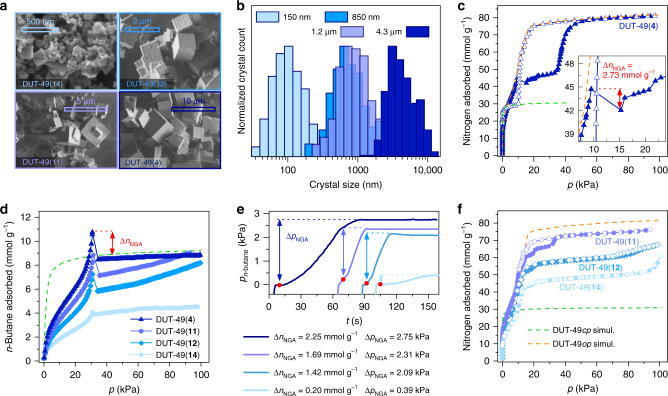
Fig. 1.
Nitrogen and n-butane adsorption isotherms of selected samples with different crystal size distribution. a SEM images of DUT-49 crystals with different size distributions, scale bars (500 nm top left, 2 µm top right, 5 µm bottom left, 10 µm bottom right) and sample codes are indicated in the Figure. b Normalized crystal size distribution of samples represented in SEM images. c Nitrogen physisorption isotherm at 77 K of DUT-49(4) (average crystal size 4.3 µm, inset shows enlargement of NGA region). d n-Butane adsorption isotherms at 298 K. e Corresponding kinetic profile upon NGA with values for ΔnNGA, pressure evolution in the cell upon NGA during n-butane adsorption at 298 K. f Nitrogen physisorption isotherms at 77 K of DUT-49(11), DUT-49(12) and DUT-49(14) with average crystal size of 1.2 µm, 850 nm and 150 nm, respectively. color code: DUT-49(4) dark blue triangles, DUT-49(11) purple pentagons, DUT-49(12) light blue diamonds, DUT-49(14) turquoise circles. Closed symbols correspond to adsorption and empty symbols to desorption. Orange and green dashed lines correspond to the simulated isotherms of DUT-49op and DUT-49cp, respectively. Red marks indicate NGA transition

