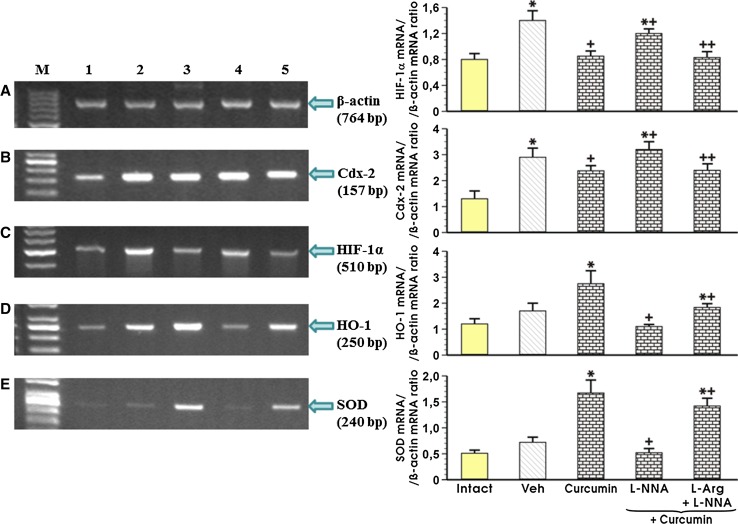
Fig. 7.
Densitometry analysis of mRNA expression for Cdx-2, HIF-1α, HO-1 and SOD 2 compared to the expression of mRNA for β-actin in the intact gastric mucosa (line 1), that with vehicle (saline) and curcumin (50 mg/kg i.g.) pretreatment (lines 2 and 3, respectively), and in those administered L-NNA (20 mg/kg i.p.), with or without l-arginine (200 mg/kg i.g.) followed by curcumin (50 mg/kg i.g.) (lines 5 and 6, respectively) and exposed to 75% ethanol. Results are mean ± SEM of three experiments. The asterisk indicates a significant change (p < 0.05) relative to the intact values (graphs 1 and 2) or vehicle-control (graphs 3 and 4). The cross indicates a significant change (p < 0.05) relative to animals pretreated with the vehicle-control (graphs 1 and 2) or with curcumin (50 mg/kg i.g.) (graphs 3 and 4). The asterisk and cross indicate a significant change (p < 0.05) relative to the values obtained in animals pretreated with curcumin (50 mg/kg i.g.) alone (graphs 1 and 2) or in combination with L-NNA (20 mg/kg i.p.; graphs 3 and 4). Double crosses indicate a significant change (p < 0.05) relative to those obtained in animals treated with a combination of L-NNA and curcumin (50 mg/kg i.g.)

