Fig. 2.

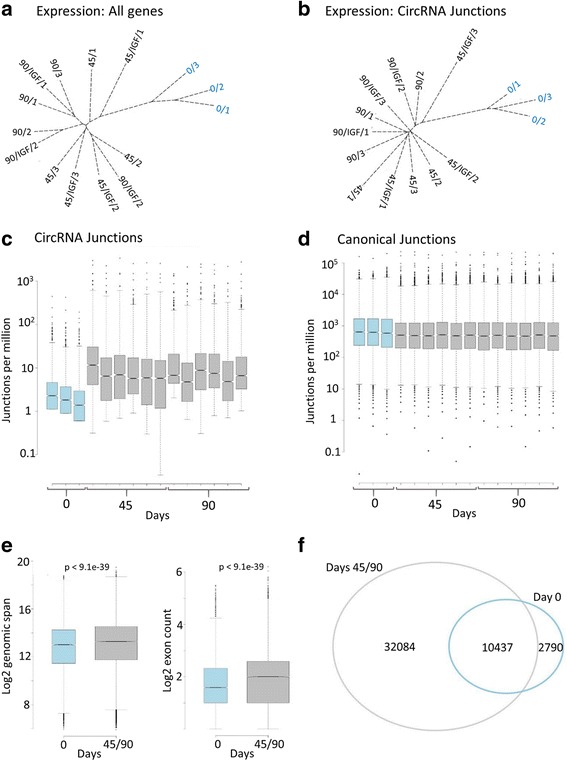
circRNA expression increases upon differentiation. a Phylogram based on expression levels of all genes. b Phylogram based on circRNA (back-splice) junction counts. Both generated using hierarchical clustering of Euclidian distances. c-d Box and whisker plots of circRNA and canonical junction counts from all genes which generate circRNAs. CircRNAs increase from ~ 0.3 to 1-2% of all junctions between day 0 and 45. e Box and whisker plots showing (left) genomic span of circRNAs in day 0 (n = 13,146) versus differentiated (day 45 and 90, n = 42,521) untreated samples, and (right) exon counts of circRNAs in day 0 only (n = 2790) versus differentiated only (n = 32,084) untreated samples. For exon count calculations, all GENCODE exons between circRNA donor and acceptor exons were included. For all box-plots, medians and upper and lower quartiles are shown, with outliers as solid circles. f Venn diagram showing distribution of circRNA junctions identified in untreated day 0 samples, relative to differentiated samples (days 45 and 90). Comparable results were obtained with IGF-1 treated samples
