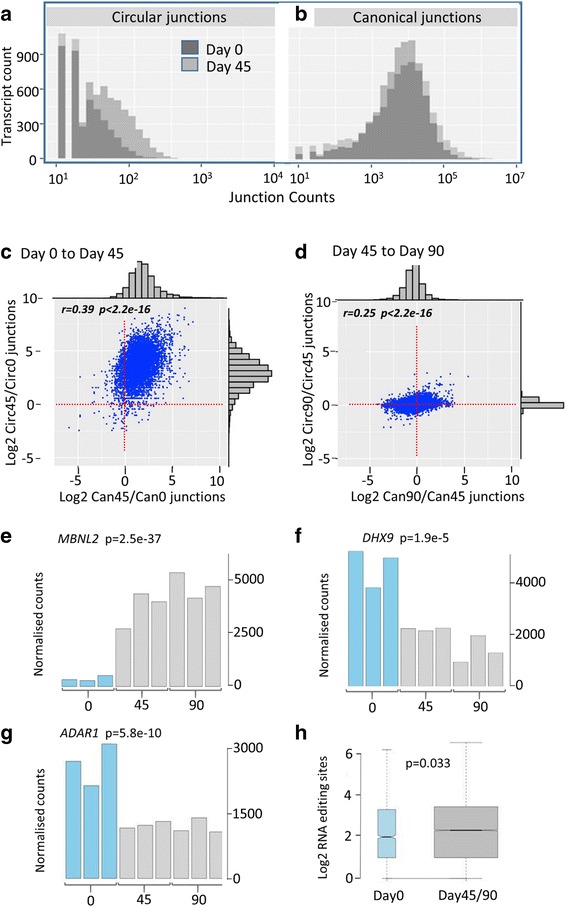
Fig. 3.

circRNA expression reaches a plateau by day 45. a-b Histograms comparing junction counts per transcript in day 0 and day 45. c-d Comparison of changes in back-splice and canonical junction count frequencies between time points. Junction counts were normalised to total read counts at each time-point. Distributions are shown on both axes, together with correlation coefficients and associated p-values. e-g Expression of genes implicated in circRNA biogenesis in untreated samples. Associated p-values from t-tests comparing means in day 0 versus day 45/90 are shown. h Box and whisker plot comparing frequencies of RNA editing sites found within 1000 bp windows flanking circRNA junctions in undifferentiated (day 0) or differentiated (day 45 and day 90) samples only, with associated p-value (Wilcoxon rank-sum test)
