
Fig. 4.
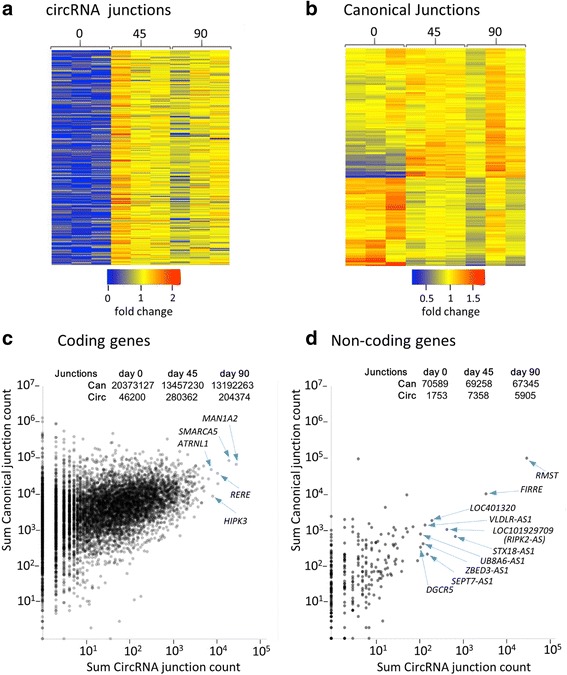
Expression increase of DE genes and abundance with respect to coding capacity. a-b Expression heat maps showing relative frequency of untreated sample junction counts from 239 DE transcripts identified in both sample-level and locus-level t-tests (see methods). c Total canonical junctions versus total circRNA junctions in all circRNA producing coding genes (summed across all samples). The 5 genes with the highest circRNA counts are indicated. d Total canonical junctions versus circRNA junctions in all circRNA producing non-coding genes (summed across all samples). The 10 genes with the highest circRNA counts are indicated. Total numbers of canonical and circRNA junctions in untreated samples at each time-point are also shown, and confirm that the increase in junction counts between days 0 and 45 affects circRNAs from both coding and non-coding genes