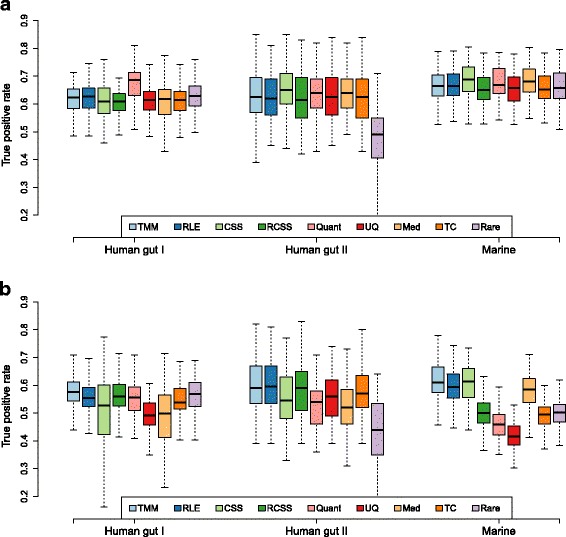
Fig. 1.

True positive rate analysis for group size 10+10. True positive rate at a fixed false positive rate of 0.01 (y-axis) for nine normalization methods and three metagenomic datasets (x-axis). The results were based on resampled data consisting of two groups with 10 samples in each, 10% DAGs with an average fold-change of 3. The DAGs were added in (a) equal proportion between the groups (‘balanced’) and in (b) in only one of the groups (’unbalanced’). The following methods are included in the figure: trimmed mean of M-values (TMM), relative log expression (RLE), cumulative sum scaling (CSS), reversed cumulative sum scaling (RCSS), quantile-quantile (Quant), upper quartile (UQ), median (Med), total count (TC) and rarefying (Rare)
