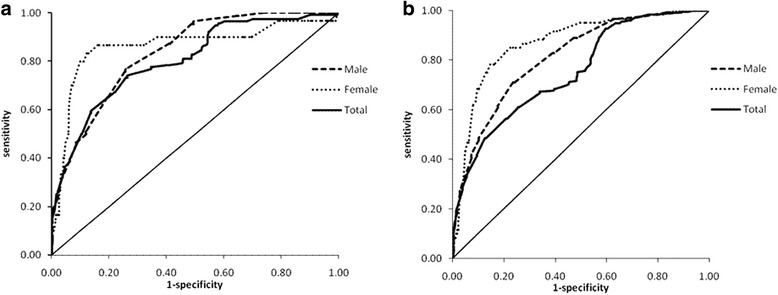
Fig. 1.

ROC curves for NC screening central obesity and overweight/obesity ((a) ROC curves for NC screening central obesity, the sensitivity, specificity and optimal cut-off point were 0.767, 0.741, 37.1 cm and 0.833, 0.878, 32.6 cm for male and female respectively. For total, the sensitivity, specificity and optimal cut-off point were 0.741, 0.735 and 36.1 cm. b ROC curves for NC screening overweight/obesity, the sensitivity, specificity and optimal cut-off point were 0.709, 0.763, 37.4 cm and 0.783, 0.853, 32.2 cm for male and female respectively. For total, the sensitivity, specificity and optimal cut-off point were 0.486, 0.873 and 37.5 cm)
