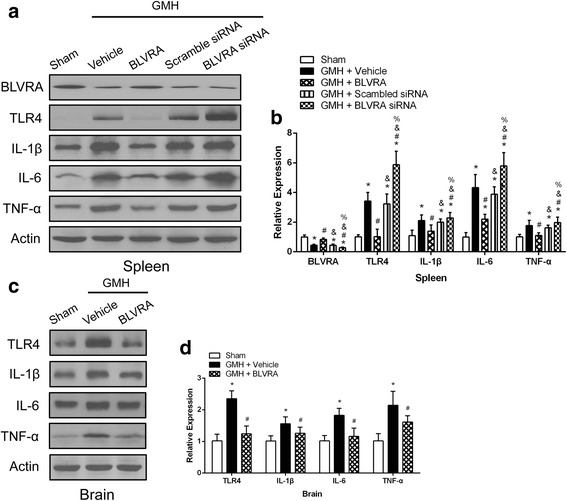
Fig. 3.

Knockdown of BLVRA aggravated GMH-induced inflammation. a Western blot analysis of BLVRA and inflammatory cytokine expression in BLVRA-treated and BLVRA-knockdown splenic tissues; representative blots are shown. b Quantitative analysis of BLVRA and inflammatory cytokine expression in BLVRA-treated and BLVRA-knockdown splenic tissues. c Western blot analysis of inflammatory cytokine expression in BLVRA-treated brain tissues; representative blots are shown. d Quantitative analysis of inflammatory cytokine expression in BLVRA-treated brain tissues. Values are expressed as mean ± SD. *P < 0.05 compared with sham, #P < 0.05 compared with GMH + vehicle. &P < 0.05 compared with GMH + BLVRA. %P < 0.05 compared with GMH + scrambled siRNA. N = 6 each group
