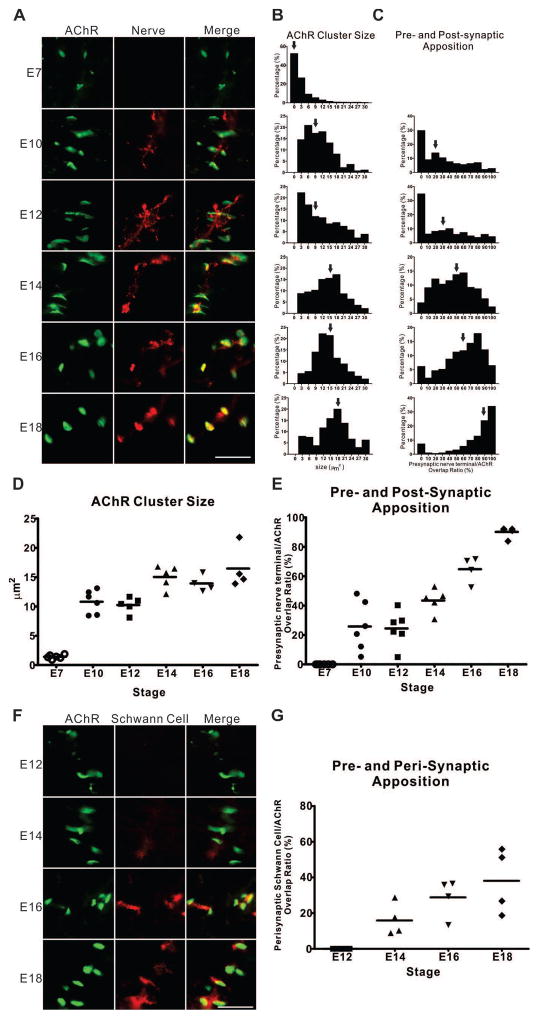
Figure 1. Quantitative analysis of NMJ development.
(A) Representative images of chicken E7 dorsal muscle mass of the hindlimbs and the PITIBs from E10 to E18 at a two-day interval show the growth in size of AChR clusters, and the apposition of AChR clusters (BTX, green) with nerve terminals (SV2, red). Scale bar =25μm. (B) The normalized distribution (percentage of the number of observations per bin of the total number within the group) of AChR cluster size and (C) the percentage of pre- and post-synaptic overlap are shown as a function of development from at least 200 NMJs. Arrows indicate the median occupancy. (D, E) The medians of the two measures (n=6, 6, 6, 5, 4, 4 for each stage, respectively) are plotted against developmental stages. (F) Representative images of the PITIBs from E12 to E18 at a two-day intervals show the ingrowth of Schwann cells (1E8, red) at the neuromuscular junctional area (BTX, green). (G) The median values of perisynaptic Schwann cell and postsynaptic AChR cluster appositions (n=4 for each stage, respectively) are plotted against developmental stages.

