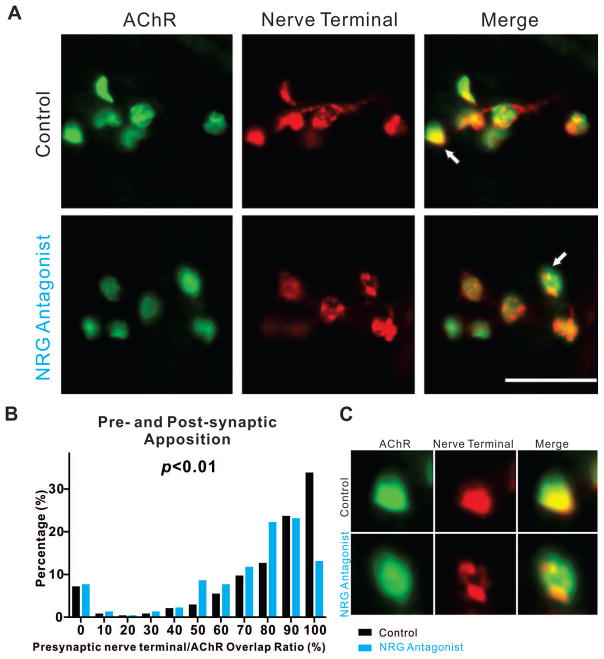
Figure 5. Reducing NRG1 function decreases pre- and post-synaptic apposition late in development.
(A) Representative stacked confocal images of E18 PITIBs with or without NRG antagonist treatment on E16 and E17 show decreased degree of postsynaptic AChR clusters (BTX, green) territory association with nerve terminals (SV2, red). Scale bar =25μm. (B) The histogram summarizes the normalized distribution (percentage of the number of observations per binned AChR cluster size of total number within the group) between Saline (control) and NRG antagonist treated embryos and shows significant decrease of the association between AChR clusters territory and axonal terminals (p< 0.05, control n=361, NRG antagonist n=334, Mann-Whitney U-test). (C) Bottom panel shows zoomed-in images of the arrowed NMJ.

