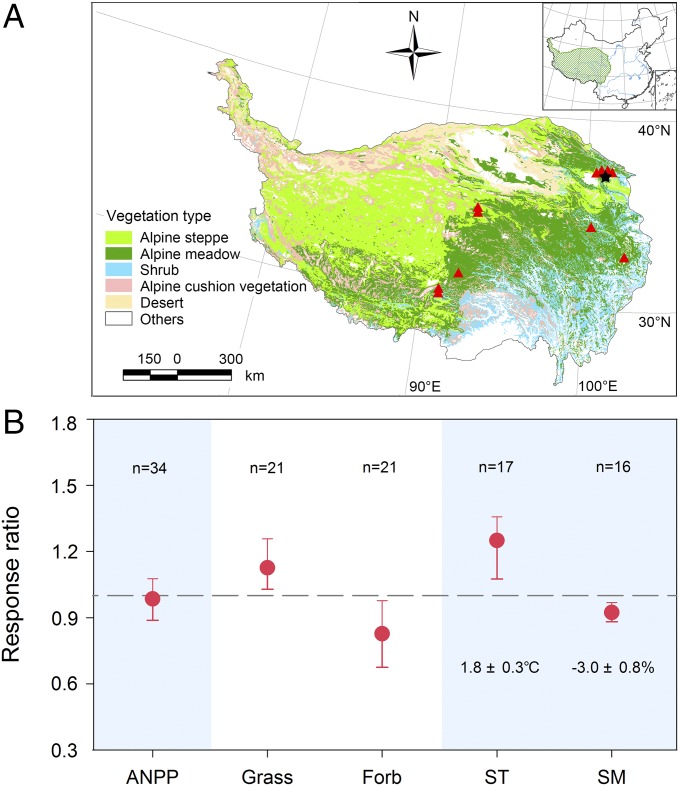
Fig. 4.
Locations of the nine sites included in the meta-analysis (A) and the response ratios from the meta-analysis (B). The star indicates the location of the experimental warming-by-precipitation site used in this study. B shows the response ratios of experimental warming on ANPP, relative abundance of grass and forb functional groups, soil temperature (ST), and soil moisture (SM). The error bars represent 95% CI. If the data did not overlap with 1, a significant warming-induced response was indicated. The numbers of studies used in analysis are shown above the bars.

