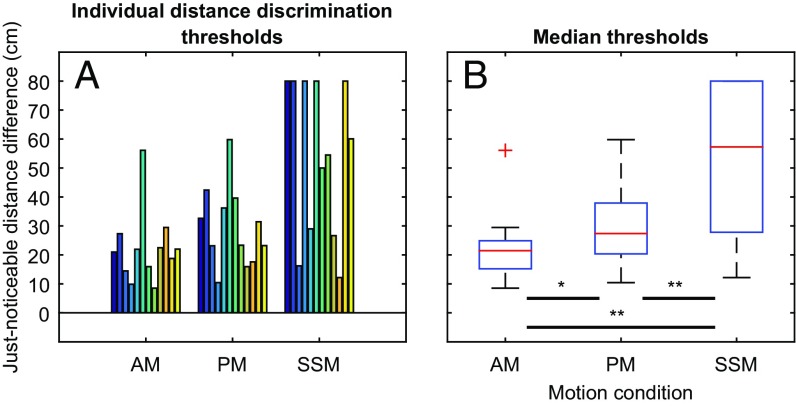
Fig. 4.
Psychophysical performance thresholds (just-noticeable differences) for sound-source distance in Exp. II. Individual data are shown by the colored bars in A; boxplots of medians (red) and interquartiles (blue boxes) are provided in B. Whiskers represent the data range expressed as the 75th percentile plus 1.5 times the difference between the 75th and the 25th percentile (maximum range) and the 25th percentile minus 1.5 times the difference between the 75th and the 25th percentile (minimum range). The red cross in B represents the only value outside the whisker range (outlier). Nonparametric paired comparisons (Wilcoxon signed rank tests) show that performance in the AM condition is significantly better than in both the PM (*P < 0.05, signed rank = 10) and the SSM condition (**P < 0.01, signed rank = 4), and that performance in the PM condition is significantly better than in the SSM condition (**P < 0.01, signed rank = 6).

