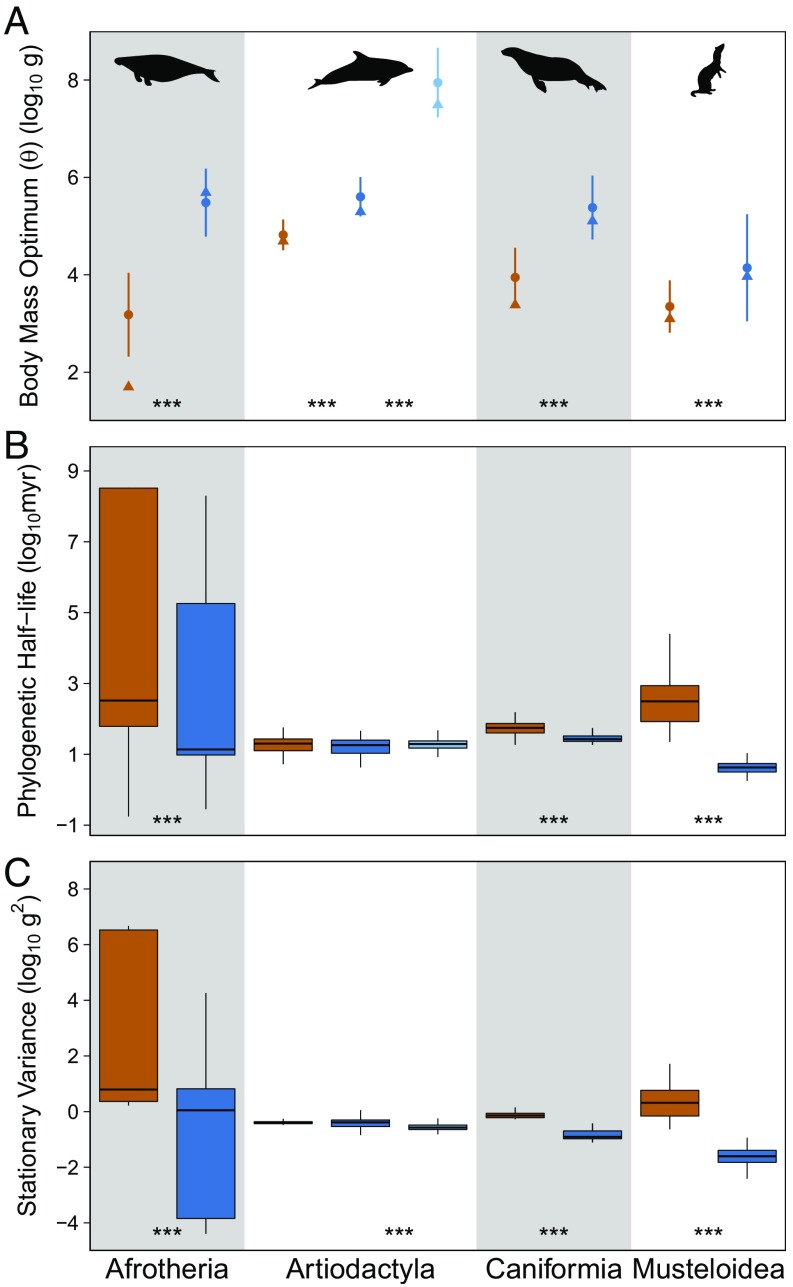
Fig. 2.
Plots of estimated body mass optima (A), phylogenetic half-lives (B), and stationary variances (C) by clade and habitat type, illustrating the statistically larger optimal body masses, equal or decreased phylogenetic half-lives, and equal or decreased stationary variance for aquatic mammals relative to their terrestrial sister groups. Optima (θ) are reported as weighted means with 2σ confidence intervals of model-averaged values (●) and are accompanied by median modern body masses (▲). Phylogenetic half-lives [ln(2)/α] and stationary variances (σ2/2α) are reported as box plots of model-averaged values. Color coding refers to habitat regime (orange, terrestrial; dark blue, toothed aquatic; light blue, baleen aquatic). Symbols at the bottom of the plots represent significance of results of pairwise Mann–Whitney tests (0 < *** < 0.001 < ** < 0.01 < * < 0.05 < . < 0.1).

