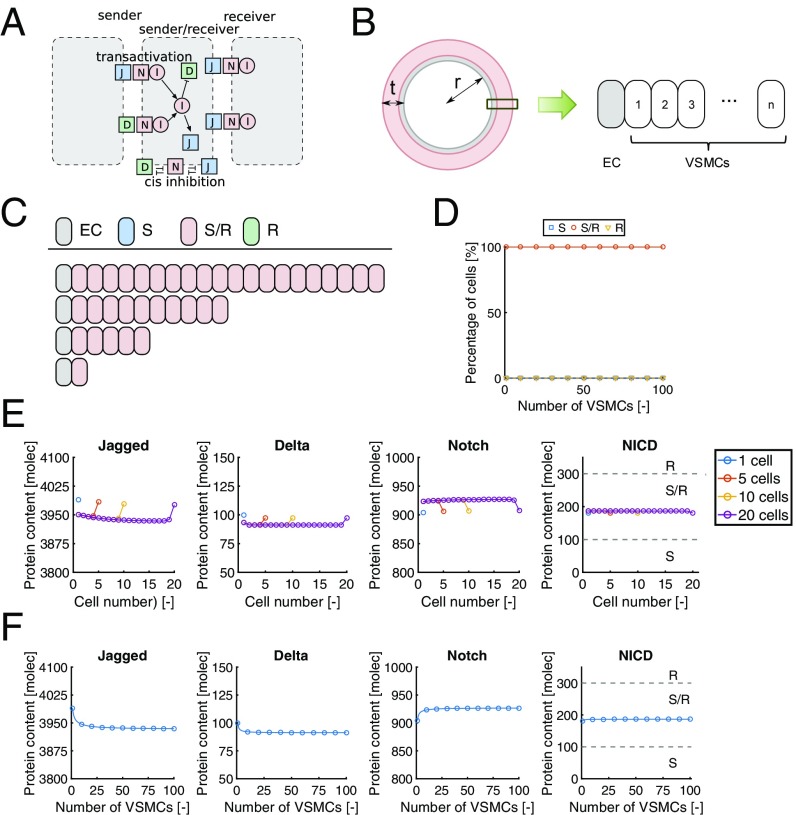
Fig. 3.
(A) Schematic representation of the protein interactions included in the theoretical framework. (B) Geometry specifications in the 1D modeling approach. Predicted (C) individual and (D) percentages of cell states for different wall thicknesses. Predicted (E) individual and (F) average protein contents for different wall thicknesses. molec, number of molecules.

