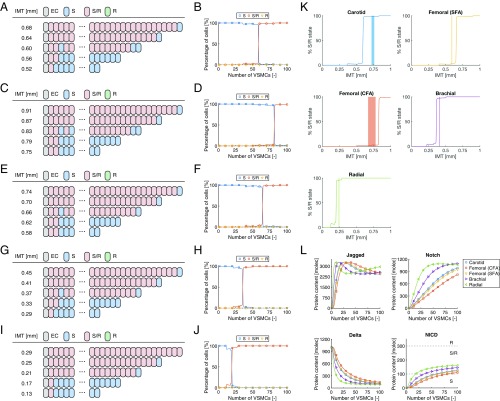
Fig. 5.
Predictions of Notch signaling in the vascular wall using the stress–strain relationship derived for older individuals. Individual and percentages of cell states for different wall thicknesses of the (A and B) carotid artery, (C and D) CFA, (E and F) SFA, (G and H) brachial, and (I and J) radial artery. (K) Percentage of S/R state VSMCs in the model (solid lines) in comparison with the reported range of IMT values for different arteries (shaded areas; see Table S1). (L) Average protein contents as a function of wall thickness as predicted for the different arteries. A, C, E, G, and I represent the results of individual simulations, where alternating cell states may randomly occur around the transition thickness as slightly varying NICD levels are close to the S-S/R threshold. B, D, F, H, J, K, and L are based on the results averaged over 25 simulations. molec, number of molecules.

