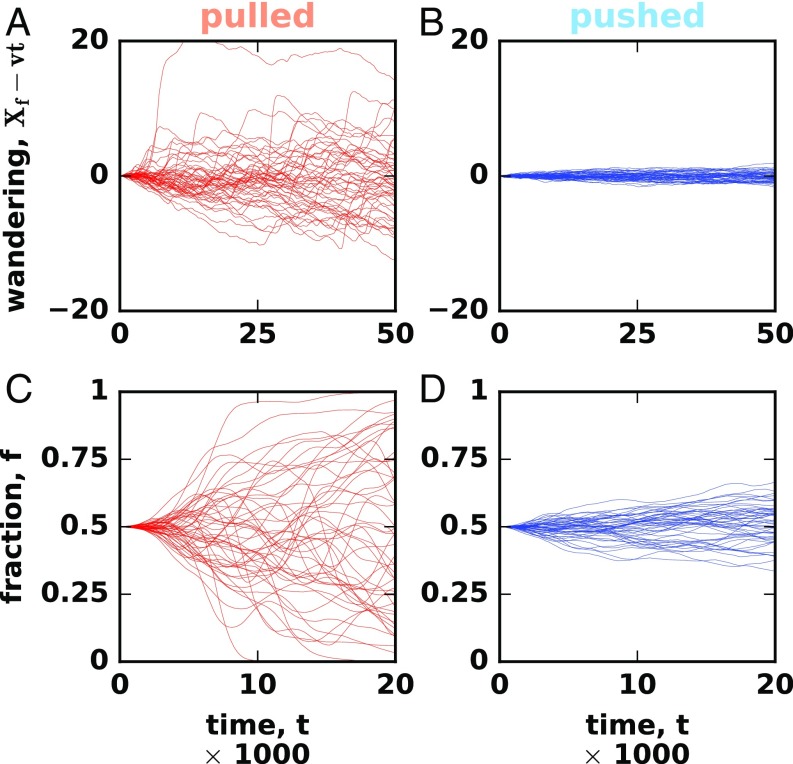
Fig. 3.
Fluctuations are much stronger in pulled than in pushed waves. A and B compare front wandering between pulled (A) and pushed (B) expansions. Each line shows the position of the front in a single simulation relative to the mean overall simulations in the plot. C and D compares the strength of genetic drift between pulled (C) and pushed (D) expansions. We started the simulations with two neutral genotypes equally distributed throughout the front and then tracked how the fraction of one of the genotypes changes with time. This fraction was computed from 300 patches centered on to exclude the fluctuations well behind the expansion front.

