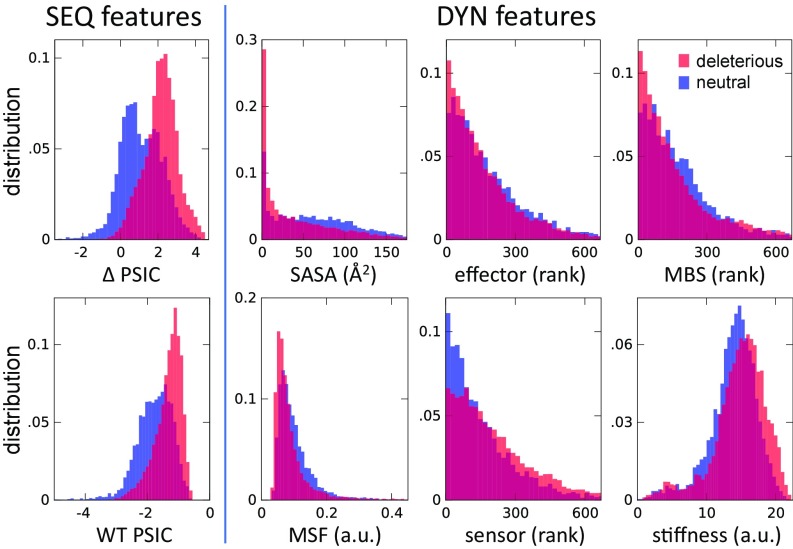
Fig. 3.
Histograms of SEQ and DYN features for neutral and deleterious variants. Each panel refers to a distinctive feature (see abscissa). The two histograms refer to the subgroups of deleterious (shown in red) and neutral (shown in blue) mutations. Sharper differences indicate higher discrimination power of the feature.

