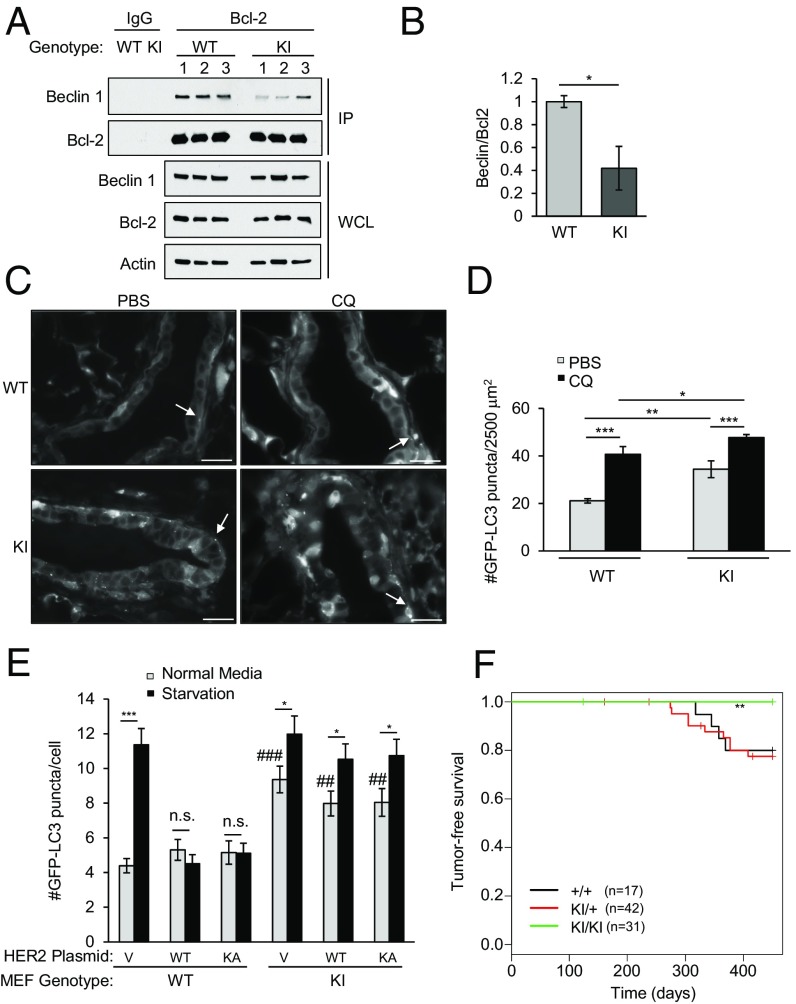
Fig. 2.
Becn1F121A knock-in mice have decreased HER2-mediated tumorigenesis. (A) Coimmunoprecipitation of Beclin 1 with Bcl-2 in mammary glands of 2-mo-old female Becn1WT (WT) and homozygous Becn1F121A (KI) mice (three mice per genotype). IP, immunoprecipitation; WCL, whole-cell lysates. (B) Densimetric quantification of the ratio of Beclin 1 compared with Bcl-2 in each sample in A normalized to a 1.0 value in the mammary glands of WT mice. Bars are mean values ± SEM of mammary glands from three mice per group. *P < 0.05; ANOVA. Representative images (C) and quantification of GFP-LC3 puncta (D) are shown in mammary epithelial ducts of Becn1WT:GFP-LC3 (WT) and Becn1F121A:GFP-LC3 (KI) mice 6 h after treatment with PBS or 50 mg⋅kg−1 chloroquine (CQ). White arrows denote representative GFP-LC3 puncta in C. *P < 0.05; ***P < 0.001; ANOVA. (E) GFP-LC3 puncta (autophagosomes) in MEFs of the indicated genotype transfected with the indicated HER2 expression plasmids and GFP-LC3 and grown in normal media or subjected to starvation (HBSS, 3 h). Bars are mean ± SEM of triplicate samples (100–150 cells per condition). Similar results were observed in three independent experiments. n.s., not significant. *P < 0.01 and ***P < 0.001 vs. normal media control; ##P < 0.01 and ###P < 0.001 for comparison of value in normal media in the indicated condition in KI MEFs vs. WT MEFs. (F) Kaplan–Meier curves for tumor-free survival of Becn1WT (+/+) Becn1WT/F121A (KI/+), and Becn1F121A (KI/KI) mice crossed with MMTV-HER2 mice. **P < 0.01; log-rank test (see also Fig. S3). (Scale bars, 100 μm.)

