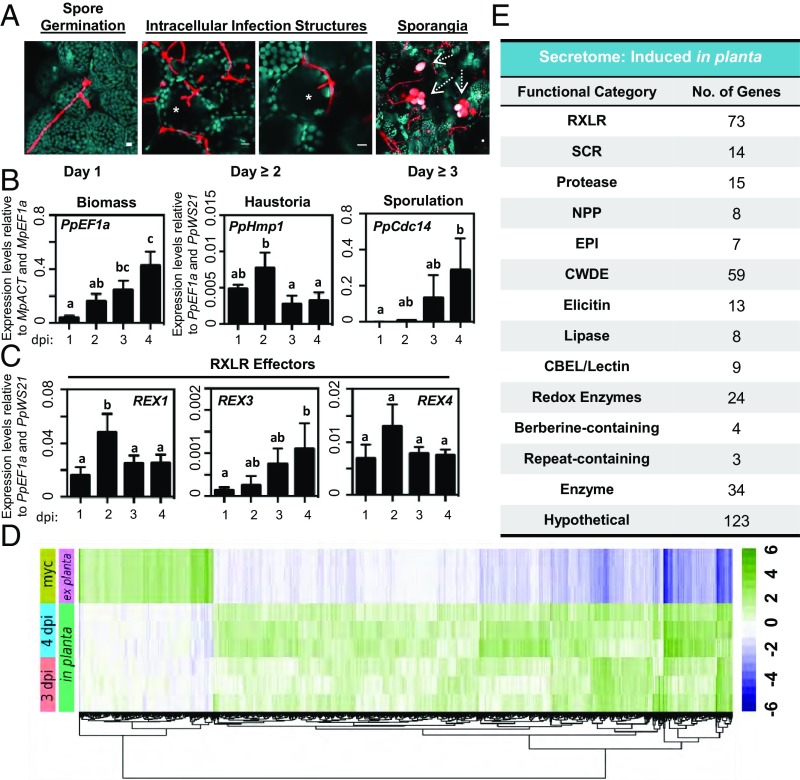
Fig. 2.
P. palmivora completes a full infection cycle that includes the intracellular colonization of living Marchantia cells. (A) Confocal fluorescence microscopy demonstrating key morphological transitions in P. palmivora lifestyle during the colonization of TAK1 plants from 1 to 3 dpi. Z-stack projections of pathogen fluorescence merged with plastid autofluorescence (turquoise). Intracellular infection structures are denoted by an asterisk. Sporangia are indicated by dashed arrows. (Scale bars, 10 μm.) (B) Quantification of P. palmivora lifestyle marker genes during the colonization of TAK1 thalli from 1 to 4 dpi via qRT-PCR analysis. Pathogen biomass (PpEF1a) was quantified relative to M. polymorpha biomass markers (MpACT and MpEF1a). Haustoria (PpHmp1) and sporulation (PpCdc14) marker genes were quantified relative to pathogen biomass controls (PpEF1a and PpWS21). Different letters signify statistically significant differences in transcript abundance [ANOVA, Tukey’s honest significant difference (HSD), P < 0.05]. (C) Quantification of P. palmivora RXLR effector gene transcripts during the colonization of TAK1 thalli from 1 to 4 dpi via qRT-PCR analysis. RXLR effector (REX1, REX3, and REX4) gene expression was quantified relative to P. palmivora biomass (PpEF1a and PpWS21). Different letters signify statistically significant differences in transcript abundance (ANOVA, Tukey’s HSD, P < 0.05). (D) P. palmivora transcriptome. Hierarchical clustering of differentially expressed genes between in planta (3 and 4 dpi) and axenically grown mycelium transcriptomes (LFC of ≥2, P value of ≤10−3). rLog-transformed counts, median-centered by gene, are shown. (E) P. palmivora secretome. Summary of functional categories of 394 genes encoding putative secreted proteins up-regulated during P. palmivora infection of M. polymorpha. Experiments in A–C were performed at least three times, with similar results.

