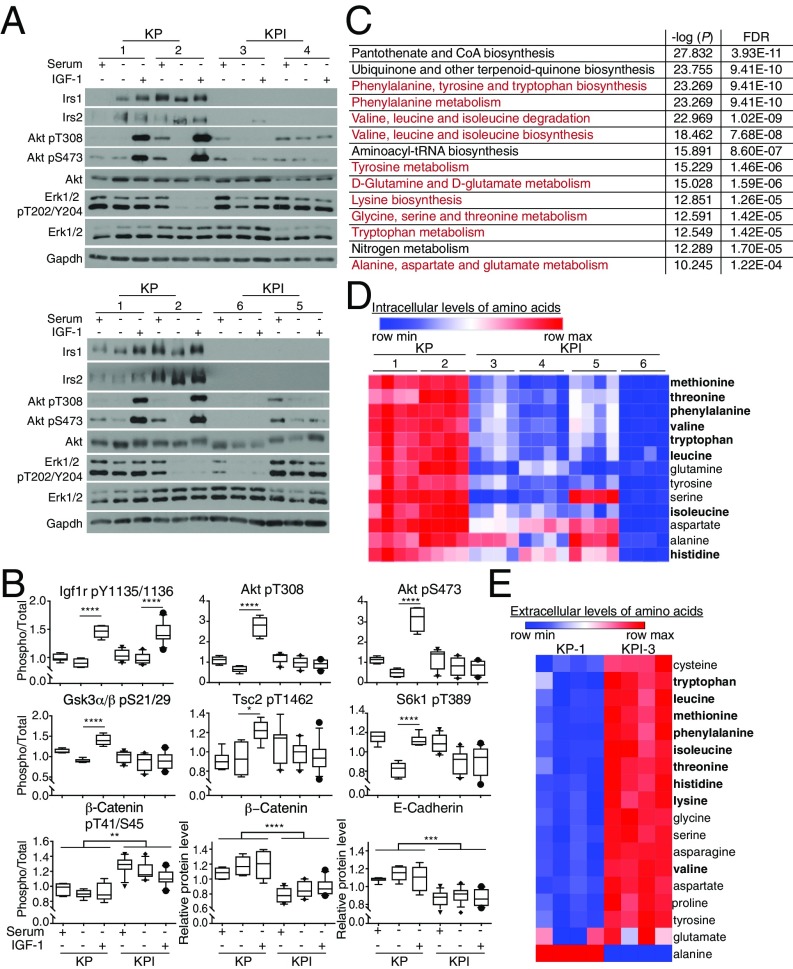
Fig. 2.
Murine Irs1/Irs2-null Kras-driven lung tumor cells have impaired Akt signaling and decreased intracellular amino acid levels. (A) Levels of Irs1, Irs2, total or phosphorylated Akt and Erk1/2 in KP and KPI cells grown in 10% serum or serum-starved for 1 h with or without IGF1 (50 ng/mL) stimulation for 10 min. Gapdh was used as a loading control. (B) Box plots representing total or phosphorylated levels of selected effectors of Akt signaling quantified by reverse-phase protein array (RPPA) in KP and KPI cells treated as in A. Levels of phosphorylated proteins were normalized to total levels of the respective proteins. Data represent the median ±10th to 90th percentile for each protein/phosphoprotein; n = 3 biological replicates per condition per cell line. *P < 0.05; **P < 0.01; ***P < 0.001; ****P < 0.0001. (C) List of top 14 metabolic pathways that are significantly different between KP (-1, -2) and KPI (-3 to -6) cells grown in 10% serum for 24 h. In red are pathways involved in amino acid metabolism. Data were processed by Metaboanalyst 3.0, and pathways were ranked by −log of the P value. FDR indicates false-discovery rate. (D and E) Heat maps listing in descending order of statistical significance (P < 0.05 by t test) amino acids whose intracellular (A) or extracellular media (B) levels are different between KP and KPI cells described in C. In bold are essential amino acids. Red indicates higher expression, and blue indicates lower expression relative to the mean expression level within each group; n = 4 biological replicates per cell line.

