Fig. 3.
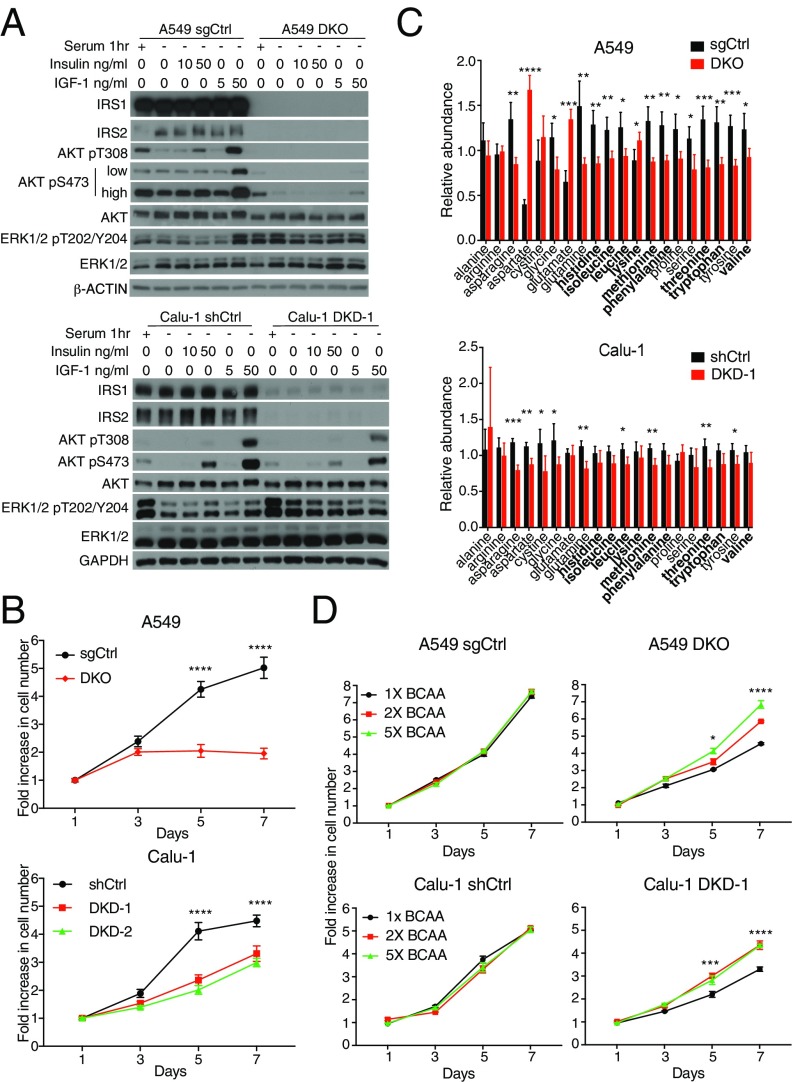
Loss of IRS1 and IRS2 in human KRAS-mutant NSCLC leads to impaired AKT signaling and reduced intracellular amino acid levels. (A) Levels of IRS1, IRS2, total or phosphorylated AKT and ERK1/2 in NSCLC A549 cells with IRS1/IRS2 (A549 DKO) or control (A549 sgCtrl) DKO as well as Calu-1 cells with IRS1/IRS2 (Calu-1 DKD-1) or control (Calu-1 shGFP/shScramble, termed shCtrl) DKD cells. Cells were serum-starved for 1 h and then stimulated with insulin or IGF1 for 10 min. β-ACTIN and GAPDH were used as loading controls. (B) Proliferation curves of cells described in A that were grown under low serum conditions (0.1% serum for A549 and 2% serum for Calu-1) over 7 d; n = 6. (C) Levels of amino acids in NSCLC cells described in A that were first normalized to protein levels, and then normalized to the median of all samples for each amino acid; n = 4 biological replicates per cell line; data are representative of two independent experiments. (D) Proliferation curves of cells described in A that were grown under low serum conditions (0.5% serum for A549 and 2% serum for Calu-1) in RPMI media containing either fivefold (5×), twofold (2×), or the standard (onefold or 1×) concentrations of BCAAs: leucine (0.05 g/L), isoleucine (0.05 g/L), and valine (0.02 g/L) over 7 d; n = 4. In B–D, data represent the mean ± SD (B and C) or ±SEM (D). *P < 0.05; **P < 0.01; ***P < 0.001; ****P < 0.0001. In B, significance is between shCtrl and DKO or DKD conditions. In D, significance is between 1× BCAA and both 2× and 5× conditions.

