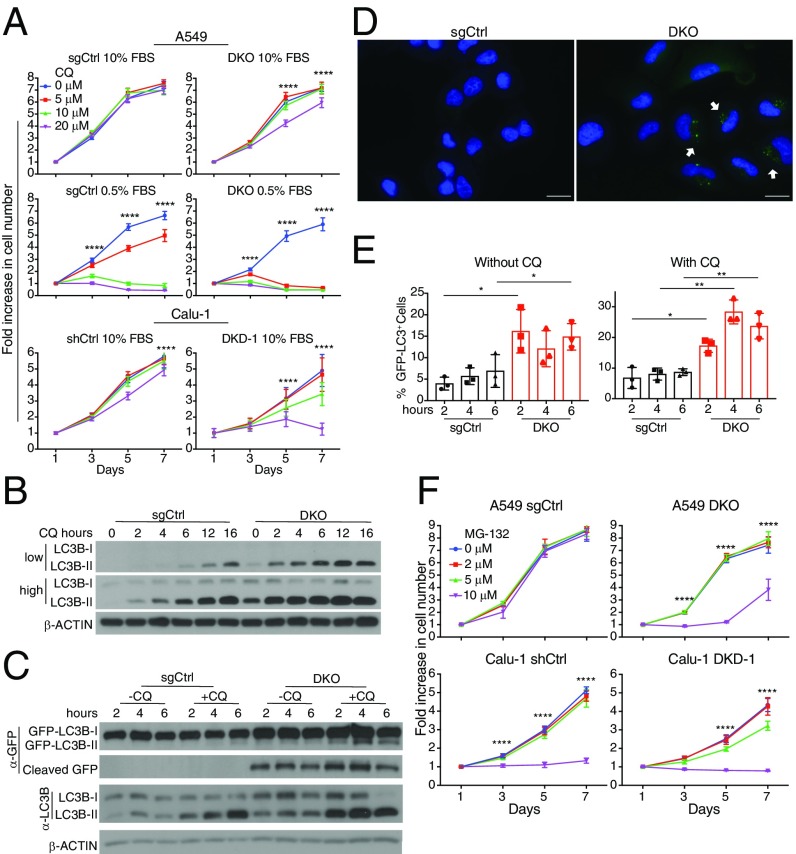
Fig. 4.
Acute loss of IRS1 and IRS2 induces autophagy in human KRAS-mutant NSCLC cells. (A) Proliferation curves of NSCLC A549 DKO or sgCtrl cells as well as Calu-1 DKD or shCtrl cells cultured in 10% serum and treated with chloroquine (CQ); n = 6; ****P < 0.0001 between 0 and 20 μM conditions. (B) Levels of LC3B-I and LC3B-II in A549 cells described in A treated with 10 μM CQ for 0–16 h. Compared with sgCtrl cells, A549 DKO cells have enhanced LC3B-II accumulation, indicating enhanced autophagic flux. (C) Increased accumulation with or without CQ treatment, of endogenous LC3B-II as well as GFP cleavage from exogenously expressed GFP-LC3B in A549 DKO compared with A549 sgCtrl cells. Cells were cultured in the presence of 10% serum with or without 10 μM CQ for 2, 4, or 6 h. In B and C, β-ACTIN was used as a loading control. (D) Fluorescence microscopy images demonstrating increased GFP-LC3 punctae (white arrows) upon loss of IRS1/IRS2 in A549 DKO compared with sgCtrl cells described in C that were treated with 10 μM CQ for 6 h. (Scale bars, 25 μM.) (E) Quantification of GFP-LC3 punctae in cells from D; n = 15–20 images per condition; *P < 0.05; **P < 0.01. Data are pooled from three independent experiments. (F) Proliferation curves of A549 and Calu-1 cells described in A, which were grown in 10% serum and treated with MG-132 for 7 d; n = 6; ****P < 0.0001 between 0 and 10 μM conditions for A549 and between 0 and 5 μM as well as 0 and 10 μM for Calu-1. In A, E, and F, data represent the mean ± SD.

