Fig. 3.
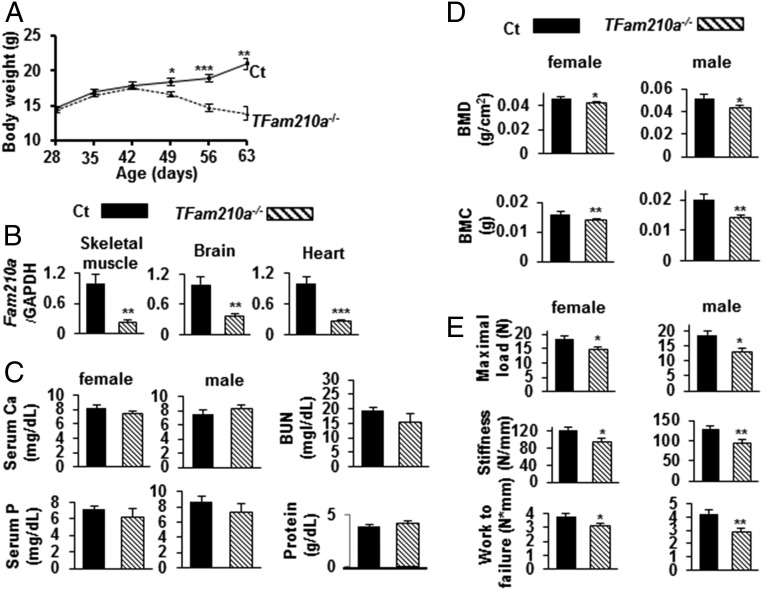
Phenotypic characterization of TFam210a−/− mice. (A) Body weight of TFam210a−/− mice and of CT mice (Fam210aflox/flox littermates) (28 d, n = 6; 35 d, n = 6; 42 d, n = 6; 49 d, n = 6; 56 d, n = 6; 63 d, n = 3) and TFam210a−/− (28 d, n = 8; 35 d, n = 8; 42 d, n = 6; 49 d, n = 6; 56 d, n = 6; 63 d, n = 3) mice, after tamoxifen injection at 28 d after birth for 5 d. (B) Quantitative RT-PCR in mouse muscle, brain, and heart extracts to assess the expression of Fam210a in Ct (n = 5) and TFam210a−/− (n = 5) mice. Data are expressed relative to the GAPDH mRNA value. (C) Serum Ca and P, in Ct (calcium: female, n = 4; male, n = 5; phosphate: female, n = 5; male, n = 5) and TFam210a−/− (calcium: female, n = 5; male, n = 5; phosphate: female, n = 5; male, n = 5) mice. BUN and total protein in Ct and TFam210a−/− (mixture of one female and two male samples, i.e., n = 3 for each parameter in Ct and in TFam210a−/−). (D) BMD and BMC of Ct (female, n = 7; male, n = 8) and TFam210a−/− (female, n = 6; male, n = 9) mouse bones. (E) Biomechanical parameters of bone strength, by three-point bending tests in femurs, including the maximal load, stiffness, and work-to-failure, in Ct (maximal load: female, n = 4; male, n = 8; stiffness: female, n = 4; male, n = 6; work-to-failure: female, n = 5; male; n = 8) and TFam210a−/− (maximal load: female, n = 4; male; n = 8; stiffness: female, n = 4; male, n = 6; work-to-failure: female, n = 8; male; n = 8). Solid bars indicate values in Ct, and hatched bars indicate values in TFam210a−/− mice. Data represent mean ± SEM. *P < 0.05; **P < 0.01; ***P < 0.001 using a two-sided Student’s t test. Analyses were done at 56 d of age.

