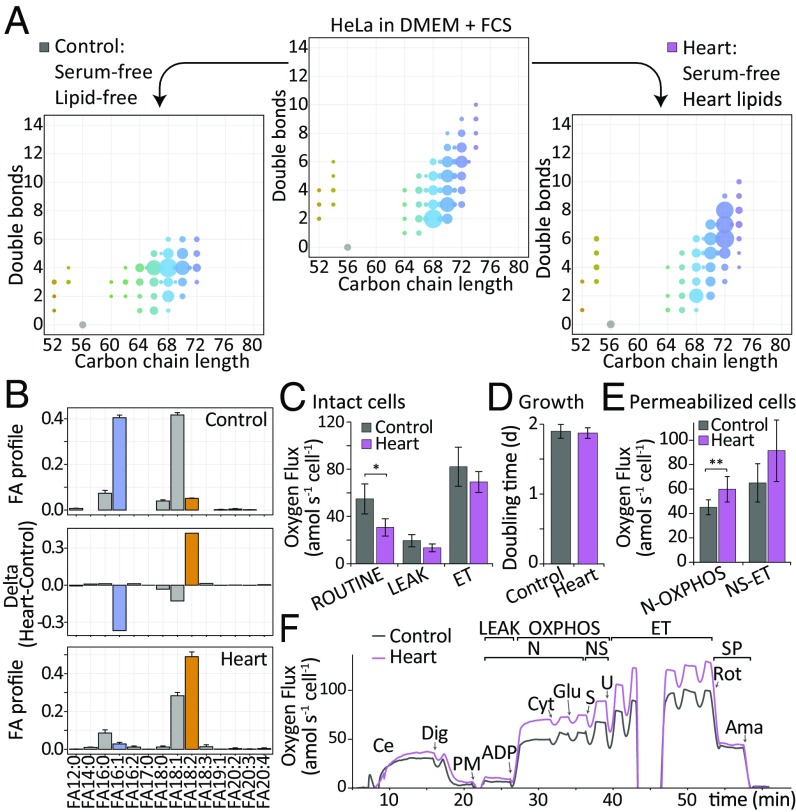
Fig. 4.
CL profile adaptation in response to lipid supplementation. (A) Quantified CL composition of HeLa cells grown in lipid and serum free (control, Left), standard (DMEM/FCS, Center), and pig heart lipids supplemented conditions (Heart, Right). One representative sample is shown (n = 4). Legend according to Fig. 1B. (B) FA composition in control (Top) and heart (Bottom) condition and their differential profile (Delta, Middle) (n = 4). (C) Oxygen flow in intact control and heart samples. (D) Doubling times of control and heart samples (n = 4). (E) Oxygen flow in permeabilized control and heart samples. NADH-pathway capacity (N-OXPHOS) was significantly increased upon heart lipid supplementation (n = 8, P = 0.01, Bonferroni-adjusted with m = 7). (F) Representative traces of oxygen flow for experiment shown in E used to calculate respiratory activities in different pathway-control states. Arrows indicate substrate-uncoupler-inhibitor titration steps: ADP, adenosine diphosphate; Ama, antimycin A; Ce, cells; Cyt, cytochrome c; Dig, digitonin; ET, maximal electron transfer capacity in presence of CCCP uncoupler (n = 4, Bonferroni-adjusted with m = 9); Glu, glutamate; LEAK, respiration after inhibition of ATP synthase; N, NADH-pathway; NS, convergent N- and succinate-pathway; PM, pyruvate and malate; Rot, rotenone; ROUTINE, cell respiration in presence of endogenous substrates; S, succinate; SP, succinate-pathway; U, uncoupler (CCCP). If not otherwise stated, data are shown as mean ± SD. *P < 0.05, **P < 0.01.

