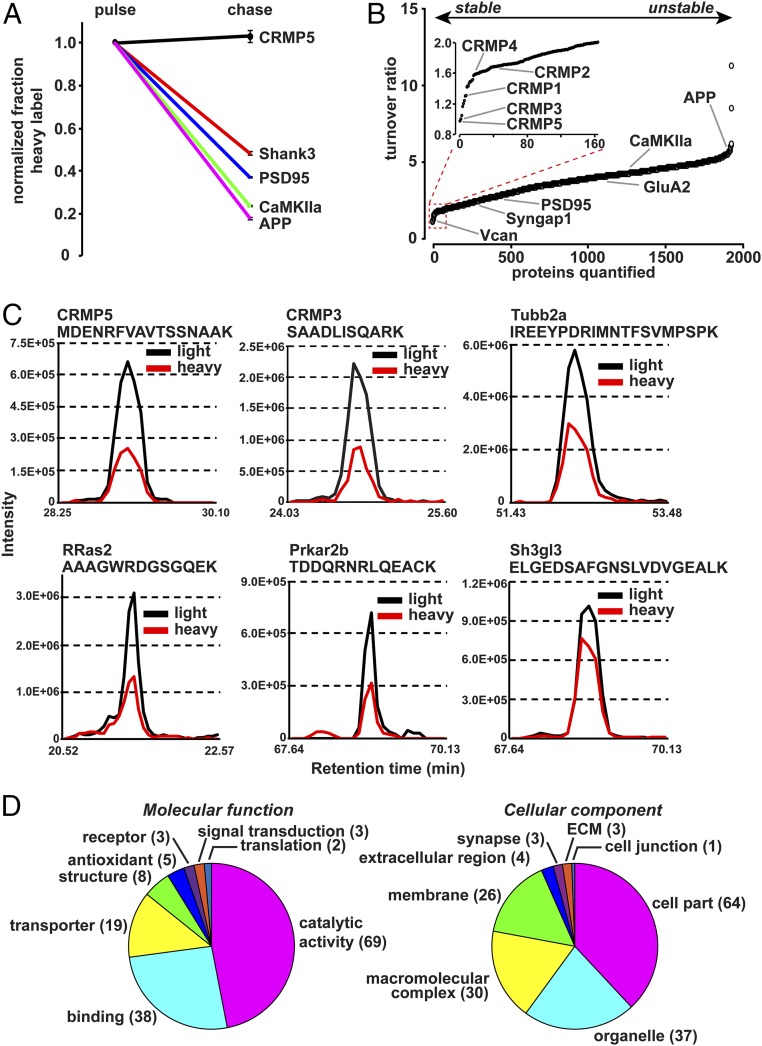
Fig. 2.
Characterization of synaptic LLPs. (A) Examples of decline in heavy label during chase, normalized to pulse. The decrease in heavy label-containing peptides during the chase period is used to indicate protein turnover, with greater decline indicating higher turnover. Data obtained from four mice from control group. (B) Plot indicates ranked turnover ratio for 2,272 proteins. The turnover ratio is calculated as the RIApulse/RIAchase. A value close to 1 indicates slow turnover, and larger values indicate greater protein turnover. (Inset) The 164 proteins defined as LLPs with a turnover ratio of 2 or less. Data obtained from four mice from control group. (C) MS1 extracted-ion chromatogram of representative peptides of LLPs from the chase period. Intensities of isotopes from eluted peptides were aligned according to their retention time and plotted for representative LLP peptides for CRMP5, CRMP3, Tubb2a, RRas2, Prkar2b, and Sh3gl3. Light isotope signal is plotted in black and heavy signal in red. (D) Chart indicates molecular functions and cellular components of 164 synaptosomal LLPs defined by at least 50% heavy label accumulated during pulse remaining after chase.

