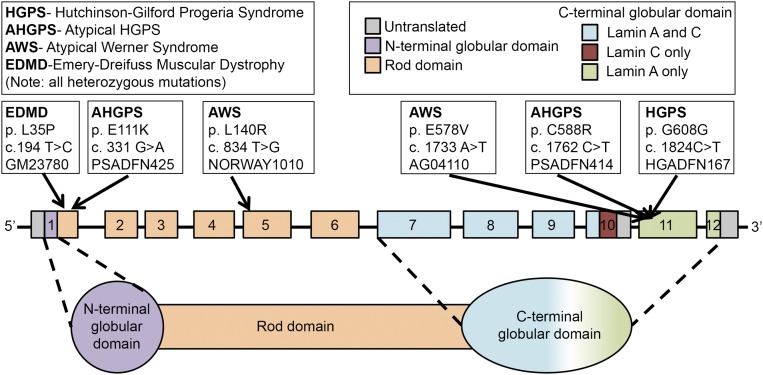
Fig. 1.
Diagram of the locations of LMNA mutations in the cell lines used in this study. Each putative causative mutation is indicated along with the name of the cell line that harbors it and the disease it causes. The top left key shows the name of each disorder, and the top right key shows the color code for the domains of lamin A and/or C. The LMNA gene is not drawn to scale. Adapted with permission from ref. 7.

