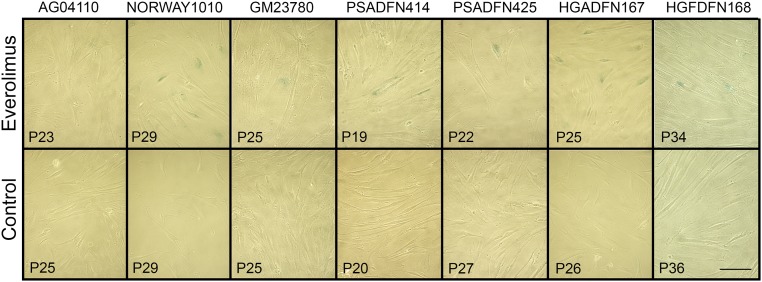
Fig. 6.
Senescence-associated β-galactosidase staining of everolimus-treated and control-treated cells. Cells were treated three times per week with 0.1 μM everolimus or vehicle control. Passage (P) number of each cell line is indicated in the lower left corner. (Scale bar: 100 μm). All control lines have β-galactosidase–positive cells (indicated by blue staining), but everolimus-treated lines are negative.

