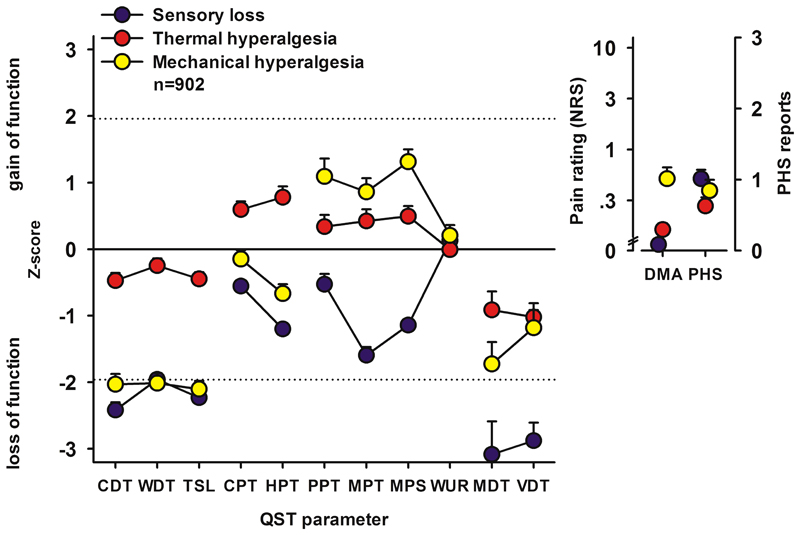
Figure 1.
The three major subgroups of sensory profiles reported in neuropathic pain patients across a range of underlying diseases. Positive z scores indicate positive sensory signs (hyperalgesia), whereas negative z values indicate negative sensory signs (hypoaesthesia and hypoalgesia). Dashed lines: 95% confidence interval for healthy subjects (−1.96 < z < +1.96). The inset graphs represent the reported pain intensity on a 0-10 numerical rating scale for dynamic mechanical allodynia and the number of episodes of paradoxical heat sensations reported during cooling stimulation, respectively. Blue symbols: cluster 1 “sensory loss” (42%) are distinguished by a loss of small and large fiber function in combination with paradoxical heat sensations. Red symbols: cluster 2 “thermal hyperalgesia” (33%) is characterized by preserved sensory functions in combination with heat and cold hyperalgesia and mild dynamic mechanical allodynia. Yellow symbols: cluster 3 “mechanical hyperalgesia” (24%) which is characterized by a loss of small fiber function in combination with pinprick hyperalgesia and dynamic mechanical allodynia.
CDT, cold detection threshold; CPT, cold pain threshold; HPT, heat pain threshold; MDT, mechanical detection threshold; MPS, mechanical pain sensitivity; MPT, mechanical pain threshold; PPT, pressure pain threshold; QST, quantitative sensory testing; TSL, thermal sensory limen; VDT, vibration detection threshold; WDT, warm detection threshold; WUR, wind-up ratio; DMA, dynamic mechanical allodynia; PHS, paradoxical heat sensations.
Adapted with permission from Baron R, et al. Peripheral neuropathic pain: a mechanism-related organizing principle based on sensory profiles. PAIN 2017;158(2):261-272.

