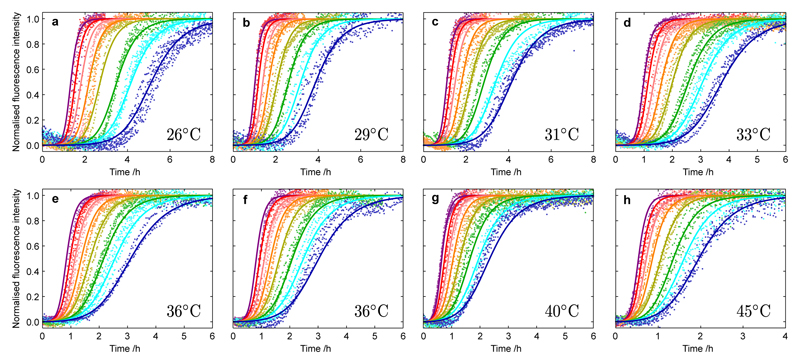
Figure 1. Kinetics of Aβ42 aggregation from purely monomeric peptide at different temperatures and initial monomer concentrations.
Normalized experimental reaction profiles, monitored by ThT fluorescence, for Aβ42 aggregation from purely monomeric peptide for different initial concentrations of monomeric peptide and at different temperatures (a) 26°C, (b) 29°C, (c) 31°C, (d) 33°C, (e-f) 36°C, (g) 40°C and (h) 45°C in 20 mM sodium phosphate, 0.2 mM EDTA, 0.02% sodium azide, pH 8.0, with 6 µM ThT. The initial concentrations of monomers were 5.0 µM (purple), 4.5 µM (red), 4.0 µM (pink), 3.5 µM (orange), 3.0 µM (yellow), 2.5 µM (green), 2.2 µM (cyan) and 1.9 µM (blue). Note the different scales on the time axes; Supplementary Fig. 1 shows the data with the same scale for each panel. The data were recorded in two sets of four temperatures with measurements at 36°C included in both sets to act as a reference condition. The solid lines are global fits at each temperature using the analytical integrated rate law for Aβ42 aggregation. Two combinations of the microscopic rate constants, k+kn and k+k2, are used to globally fit the entire data set in each panel, in terms of rate constants for elongation (k+), primary nucleation (kn) and secondary nucleation (k2). The rate parameters determined at each temperature from the global fitting are plotted in Fig. 3a,b.

