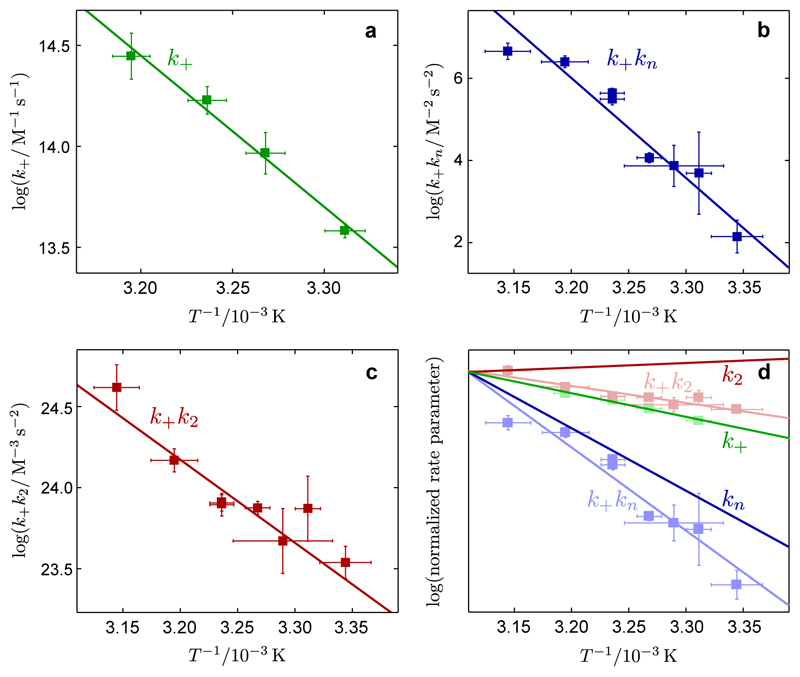
Figure 3. Arrhenius behavior of the microscopic rate constants for Aβ42 aggregation.
Arrhenius plots showing the temperature dependence of the rate parameters determined from the analytical fitting in Figs. 1, 2: (a) for k+, (b) for the combined rate parameter k+kn, (c) for the combined rate parameter k+k2, in terms of rate constants for elongation (k+), primary nucleation (kn) and secondary nucleation (k2). (d) shows how the data from (a-c), which is plotted as the faded data points and lines, are combined to give the temperature dependencies of the individual rate constants. Interestingly, while k+ and kn increase at higher temperatures, k2 has a weak temperature dependence with the opposite trend. The error bars for the rate parameters represent standard errors from the global fits shown in Figs. 1-2 and for the temperatures indicate the ranges of fluctuations recorded during each experiment.

