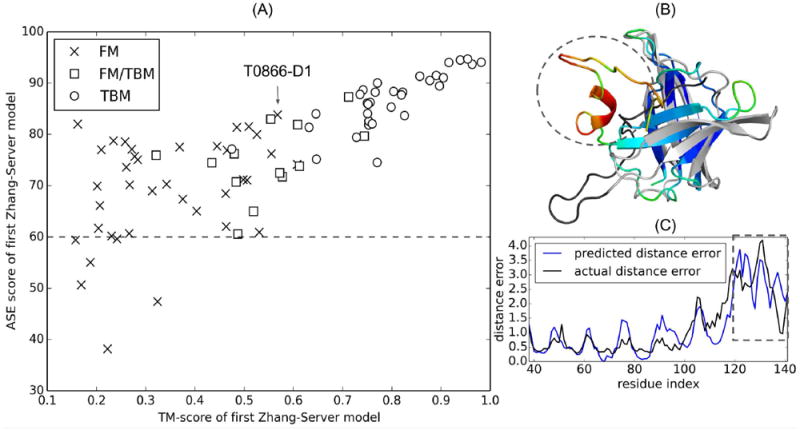
Figure 10.

(A) The accuracy of ResQ predicted residue-level quality (ASE score) versus TM-score for the first “Zhang-Server” model. The horizontal dashed line corresponds to ASE score of 60. The FM target T0866-D1 is indicated by an arrow. (B) Superposition of the native structure and the first “Zhang-Server” model of T0866-D1 (TM-score=0.51, GDT_TS=48, ASE=81.51). The native structure is colored in grey, except for the C-terminal tail (residues 119-141) that is colored in black. The same C-terminal tail in the “Zhang-Server” model is highlighted by a dashed circle. The “Zhang-Server” model is colored in spectrum color scheme according to predicted residue quality by ResQ, where blue to red color indicates increasing distance error. (C) Overlay of the distance error predicted by ResQ and the actual distance error (y-axis, higher values indicate worse residue qualities) for T0866-D1. The region of 119-141 with a high distance error is highlighted with a dashed rectangle.
