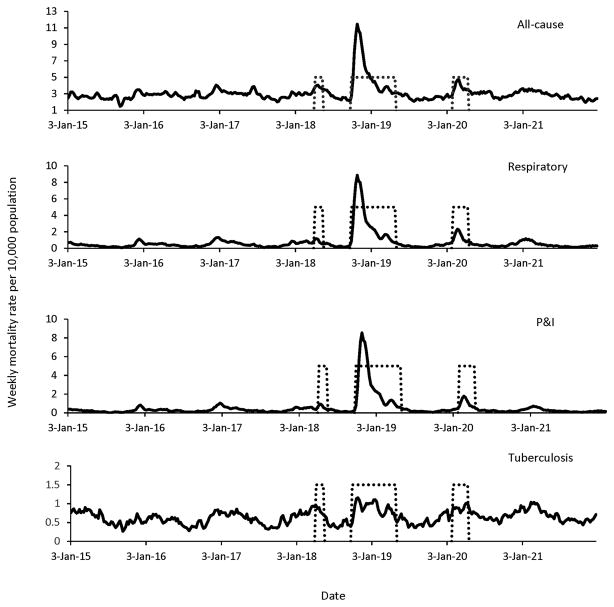
Figure 2.
Weekly time series of all the studied causes of death per 10,000 population in Arizona, 1915–1921. The dotted lines represent the time period of high mortality associated with pandemic waves occurring in spring of 1918 (April), fall 1918 (October–December), winter 1919 (January–April) and winter 1920 (February–April)

