
Figure 2. Cell association and internalization of Tf-L.
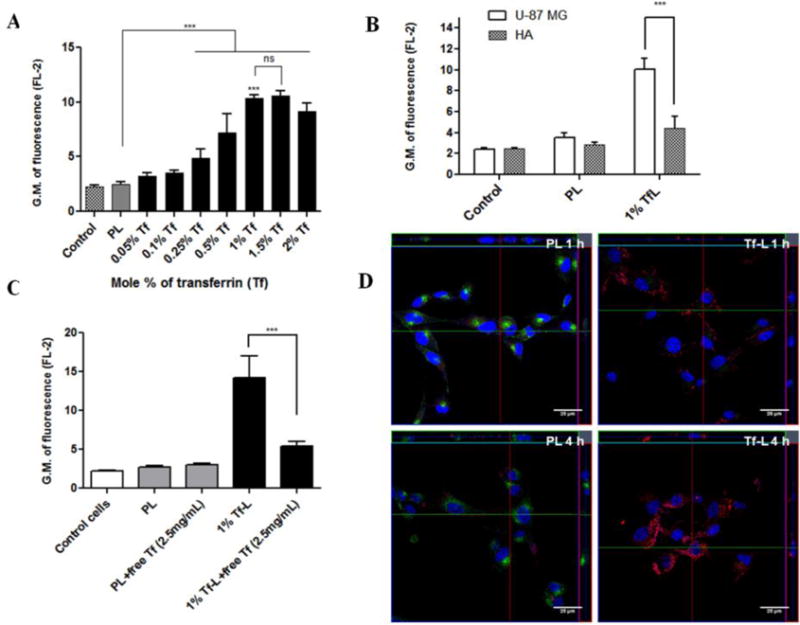
(A) U-87 MG cells were treated with Rh- labeled Tf-L with varying Tf densities (0.05-2 mol %) on their surface for 4 h. (B) U-87 MG and HA were treated with Rh-labeled PL and 1%Tf-L for 4 h. (C) U-87 MG cells were treated with Rh-labeled Tf-L for 4 h either with or without pre-treatment with free Tf (2.5 mg/ml) for 30 min to study the competitive inhibition of Tf-L uptake. Data are plotted as geometric mean of fluorescence in the FL-2 channel (mean ±SD) from at least three independent observations. (D) U-87 MG cells were treated with Rh-labeled PL and 1% Tf-L at a final lipid concentration of 0.1 mg/ml for 1 h (top panel) or 4 h (bottom panel) respectively. Nucleus was stained with Hoechst 33342, and Tf-Alexa Fluor 680® was used as the endosomal marker. The cells were analyzed by confocal microscopy. Scale bar, 25 μm. Representative orthogonal projections of PL and Tf-L treated cells at 1 h and 4 h showing XY, YZ and XZ planes respectively. The main image shows the XY plane, the section to the right on the image represents the YZ plane and the section at the top of the image shows the XZ plane of the image.