
Figure 3. Cytotoxicity of RES formulations.
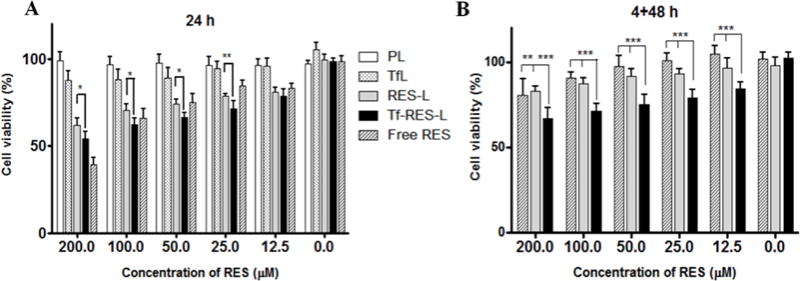
(A) U-87 MG cells were treated with free RES, RES-L or Tf-RES-L continuously for 24 h or for (B) 4 h followed by a wash and an additional 48 h, before assessment of cytotoxicity. PL and Tf-L were used as controls. Cells were treated with formulations containing 12.5-200 μM RES. Data are plotted as mean ±SD, averaged from triplicate wells in at least 3 independent experiments. One-way ANOVA was used to compare between groups, p < 0.05 was considered significant (*p<0.05, **p < 0.01, ***p< 0.001).