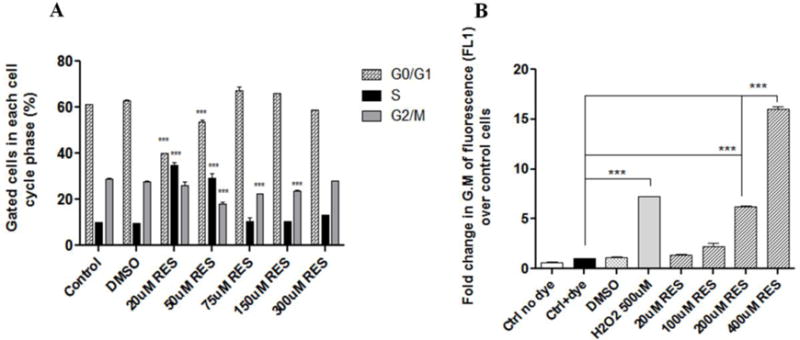
Figure 5. Effect of RES on cell cycle and ROS generation in U-87 MG cells.

(A) Cells were treated with free RES in DMSO (0-300 μM) for 24 h. Following treatments, cells were collected and processed for cell-cycle analysis. All comparisons are with the control (untreated) cells. (B) Cells were treated with CM-H2DCFDA (1 μM) for 30 min, followed by treatments for 1 h with free RES (20-400 μM) to study the generation of ROS. Following the 1 h incubation, cells were processed for flow cytometry. Results are represented as fold change in the geometric mean of fluorescence (FL-1) over control cells (B). Data are plotted as mean ±SD, averaged from triplicate wells in at least 3 independent experiments. One-way ANOVA was used to compare between groups, p <0.05 was considered significant (***p< 0.001).
