
Figure 6. Effects of RES formulations on tumor growth inhibition and survival in U-87 MG tumor xenograft bearing mice.
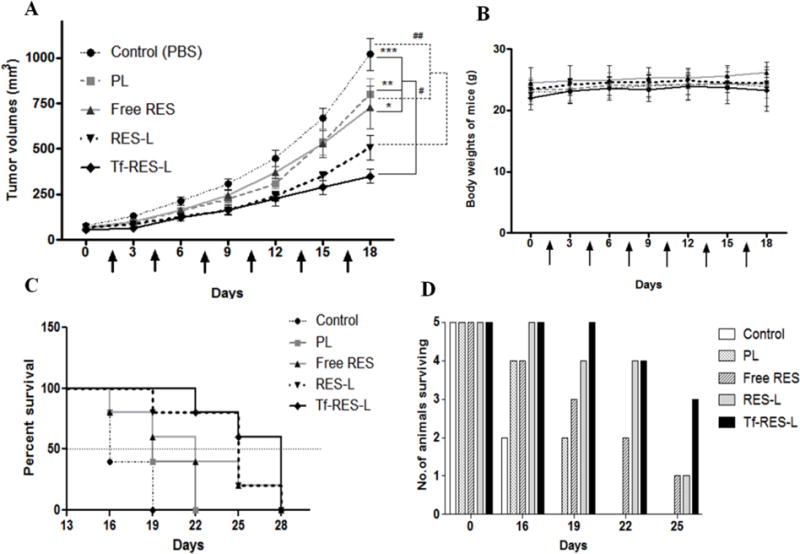
(A) The figure represents a line-graph for the tumor growth inhibition study. Arrows indicate the treatments, which were administered every third day. Statistical comparisons are shown at the end of the treatment period. The solid lines and * show comparison of the PBS, PL and free RES groups with the Tf-RES-L group, and the dashed lines and # show comparisons between the PBS and PL groups with the RES-L group. Tumor volumes are represented as Mean ± SEM for 5 animals per each treatment group. Two-tailed Student’s t- tests were used to compare between treatment groups and p < 0.05 was considered statistically significant (* p <0.05, ** p < 0.01and *** p < 0.001) (B) Body weights of mice recorded during the study. Data are represented as mean ± SD for each group of animals. (C) A modified survival analysis was carried out for all the mice that were included in the tumor-inhibition study (n=5 per group). The end point was a tumor volume of 1000 mm3. Kaplan-Meier survival curves were plotted for each treatment group and the data were analyzed using the Log-rank (Mantel-Cox) test, p < 0.05 was considered significant. (D) Column graph of the number of animals surviving in each treatment group during a 25-day period.