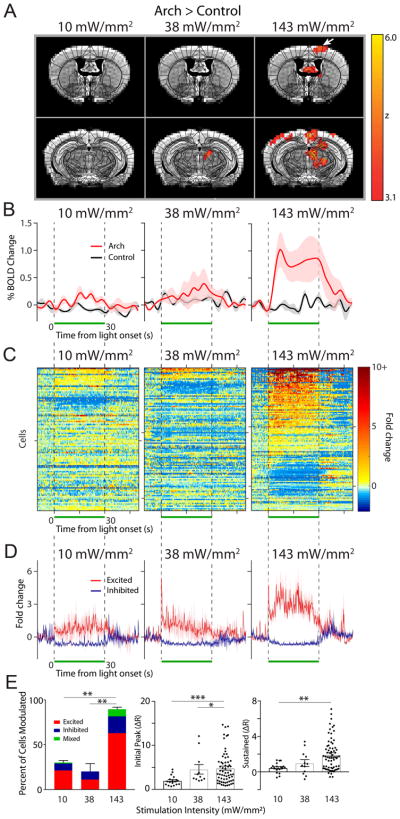
Figure 3. Effects of light intensity on the modulation of neural activity in the motor cortex.
(A) OfMRI BOLD signals (Arch>control) generated by 3 different light intensities applied at 5 Hz. As in Fig. 2, an atlas of subdivided brain structures (black lines) is overlaid on top of the BOLD signal (yellow-red) and representative structural images (grayscale) at 2 different slice planes (Y: −0.22 and −2.7 mm from Bregma). (B) Time course of average percent change in BOLD activation (red) and control (black) at each indicated intensity (n=4 mice/group), calculated in a subregion of the contralateral motor cortex containing significantly activated voxels in the 143 mW/mm2 Arch group (A, left). The light was pulsed at 5 Hz during the time window indicated by the green bar. Shaded areas indicate s.e.m. (C) The fold change in baseline subtracted firing rate ((R-R0)/R0) is shown for all recorded cells during the, 10 (n=97), 38 (n=109), 143 (n=107) mW/mm2 stimulation period (green bar; n=3 animals). Responses are thresholded to 10× the fold rate change to improve visualization of neural activity. Starting from the top, every 50th cell is marked by a tick along the y-axis (i.e. y-axis=50 cells/tick). 200 ms/bin (D) The average neural response across cells that were significantly excited (red) and inhibited (purple) is plotted for each frequency. (E) Left, summary graph of the percent of cells modulated and the modulation type for each frequency of stimulation (one-way ANOVA with post-hoc Tukey’s test **p<0.01 The average magnitude of the initial peak (0–4 ms, middle) and sustained increase (averaged between 10–20 ms, right) for all excited cells is plotted for each frequency (Kruskal-Wallis with post-hoc Dunn’s test *p<0.05, **p<0.01, ***p<0.001)

