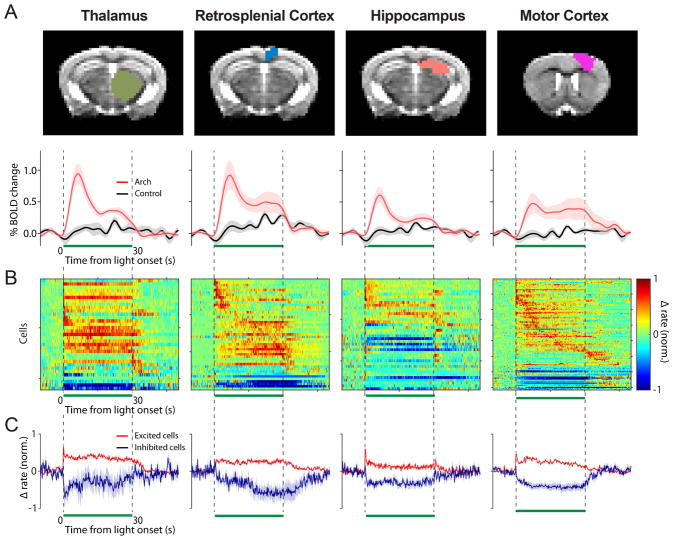
Figure 5. The cerebellar forelimb region can modulate activity of putative cells in the dorsal thalamus, retrosplenial cortex, dorsal hippocampus, and motor cortex.
(A) Top, anatomical masks overlaid on an example coronal structural for the indicated brain region. Bottom, the average BOLD time course is plotted for the entire thalamus, retrosplenial cortex, hippocampus, and motor cortex (red: Arch, n=9; black: control, n=7). A 5 Hz, 143 mW/mm2 stimulus was applied during the 30 s pulse indicated by the green bar. (B) To visualize and compare the temporal dynamics of the spiking response between activated brain regions, the change in firing rate from baseline is normalized to the max rate, unlike Figs. 2,3C. Only the cells found to be modulated in the four regions are displayed (dorsal thalamus n=36 modulated/69 total, retrosplenial cortex n=53/70, dorsal hippocampus n=41/59, and motor cortex n=107/120), y-axis = 15 cells/tick. (C) The average change in firing rate from baseline normalized to peak firing rate is displayed for the excited (red) and inhibited (purple) cells.

