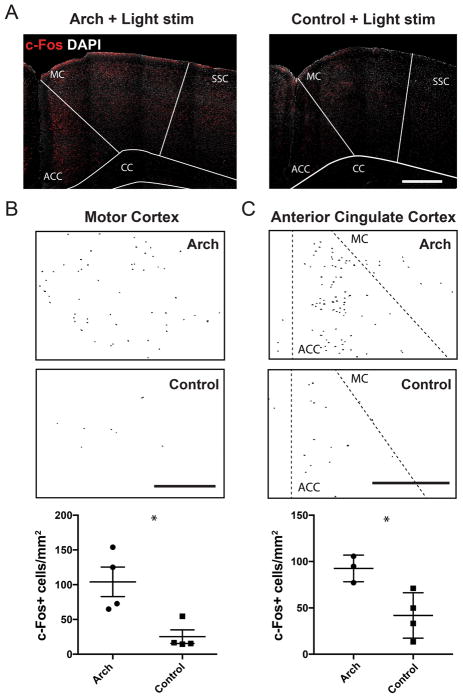
Figure 6. Light stimulation increases the number c-Fos+ cells in the motor and anterior cingulate cortices.
(A) Confocal micrographs of c-Fos (red) and DAPI (grey) immunostained coronal brain sections from an Arch-expressing (left) and control (right) mouse. Light stimulation parameters at the forelimb region of the cerebellar cortex was identical to that of ofMRI scans (5 Hz, 143 mW/mm2, 30 s alternating on and off for 10 minutes). A higher number of c-Fos+ cells are visible in the motor cortex (MC) and anterior cingulate cortex (ACC) of Arch mice compared to control. Thresholded c-Fos+ cells in the MC (B) and ACC (C) of Arch (top) and L7-cre control (middle) mice, detected by particle analysis. Scatter plots at the bottom represent normalized c-Fos+ cell count in each region of Arch and control mice (ACC located between dashed lines in C). Lines represent average ±SEM. * denotes p<0.05. SSC, somatosensory cortex; CC, corpus callosum. All scale bars represent 500 μm.

