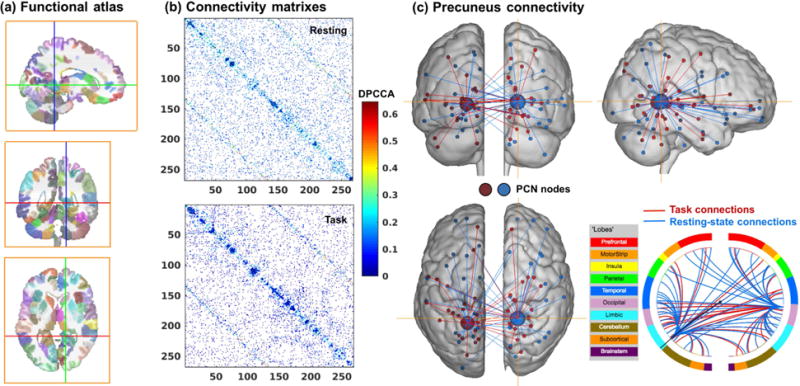
Figure 2.

(a) Yale functional brain atlas of 268 nodes covering the whole-brain (Shen et al., 2013). (b) Connectivity matrix of the 268 nodes, given by the DPCCAmax values thresholded at 90% percentile for rest and task. (c) Ventral precuneus connections as an example to illustrate network connectivity. In the circle plot, lines indicate the ‘networks’ to which precuneus nodes are connected.
